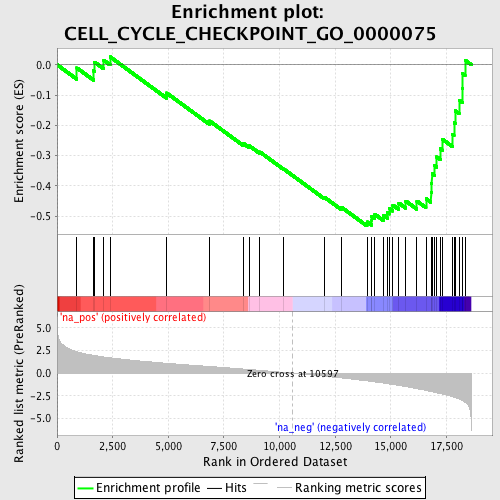
Profile of the Running ES Score & Positions of GeneSet Members on the Rank Ordered List
| Dataset | set03_truncNotch_versus_wtNotch |
| Phenotype | NoPhenotypeAvailable |
| Upregulated in class | na_neg |
| GeneSet | CELL_CYCLE_CHECKPOINT_GO_0000075 |
| Enrichment Score (ES) | -0.5324154 |
| Normalized Enrichment Score (NES) | -2.0345497 |
| Nominal p-value | 0.0 |
| FDR q-value | 0.008883622 |
| FWER p-Value | 0.143 |
| PROBE | GENE SYMBOL | GENE_TITLE | RANK IN GENE LIST | RANK METRIC SCORE | RUNNING ES | CORE ENRICHMENT | |
|---|---|---|---|---|---|---|---|
| 1 | ERCC2 | 889 | 2.361 | -0.0105 | No | ||
| 2 | PML | 1644 | 1.966 | -0.0200 | No | ||
| 3 | RAD9A | 1677 | 1.953 | 0.0091 | No | ||
| 4 | NEK11 | 2098 | 1.788 | 0.0148 | No | ||
| 5 | MAD2L2 | 2384 | 1.691 | 0.0261 | No | ||
| 6 | DDB1 | 4922 | 1.093 | -0.0931 | No | ||
| 7 | CDKN2B | 6856 | 0.733 | -0.1856 | No | ||
| 8 | TGFB1 | 8358 | 0.463 | -0.2591 | No | ||
| 9 | RAD1 | 8641 | 0.409 | -0.2678 | No | ||
| 10 | FANCG | 9112 | 0.321 | -0.2880 | No | ||
| 11 | BUB1 | 10189 | 0.087 | -0.3445 | No | ||
| 12 | XPC | 12019 | -0.329 | -0.4378 | No | ||
| 13 | CHEK1 | 12792 | -0.517 | -0.4712 | No | ||
| 14 | CDC6 | 13931 | -0.843 | -0.5191 | Yes | ||
| 15 | ATM | 14127 | -0.911 | -0.5152 | Yes | ||
| 16 | BIRC5 | 14134 | -0.913 | -0.5011 | Yes | ||
| 17 | TTK | 14282 | -0.959 | -0.4938 | Yes | ||
| 18 | ERCC3 | 14676 | -1.088 | -0.4978 | Yes | ||
| 19 | KNTC1 | 14846 | -1.150 | -0.4887 | Yes | ||
| 20 | PCBP4 | 14926 | -1.177 | -0.4744 | Yes | ||
| 21 | TIPIN | 15091 | -1.244 | -0.4635 | Yes | ||
| 22 | CCNG2 | 15359 | -1.345 | -0.4566 | Yes | ||
| 23 | CDT1 | 15674 | -1.479 | -0.4501 | Yes | ||
| 24 | ZWINT | 16172 | -1.700 | -0.4500 | Yes | ||
| 25 | CDC45L | 16582 | -1.897 | -0.4421 | Yes | ||
| 26 | CDKN2A | 16805 | -2.022 | -0.4220 | Yes | ||
| 27 | ZW10 | 16818 | -2.028 | -0.3906 | Yes | ||
| 28 | CCNE2 | 16850 | -2.041 | -0.3600 | Yes | ||
| 29 | CHFR | 16958 | -2.095 | -0.3327 | Yes | ||
| 30 | RAD17 | 17065 | -2.152 | -0.3044 | Yes | ||
| 31 | NBN | 17226 | -2.246 | -0.2775 | Yes | ||
| 32 | RB1 | 17323 | -2.301 | -0.2463 | Yes | ||
| 33 | ATR | 17777 | -2.586 | -0.2298 | Yes | ||
| 34 | BUB1B | 17842 | -2.637 | -0.1915 | Yes | ||
| 35 | MAD2L1 | 17898 | -2.685 | -0.1520 | Yes | ||
| 36 | CHEK2 | 18071 | -2.831 | -0.1166 | Yes | ||
| 37 | HUS1 | 18218 | -3.005 | -0.0769 | Yes | ||
| 38 | CCNA2 | 18230 | -3.023 | -0.0297 | Yes | ||
| 39 | SMC1A | 18339 | -3.191 | 0.0149 | Yes |
