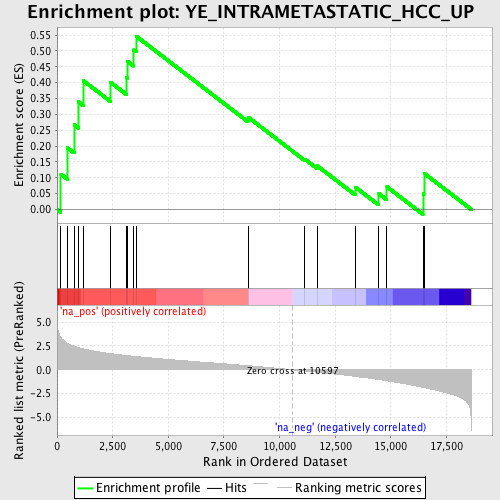
Profile of the Running ES Score & Positions of GeneSet Members on the Rank Ordered List
| Dataset | set03_truncNotch_versus_wtNotch |
| Phenotype | NoPhenotypeAvailable |
| Upregulated in class | na_pos |
| GeneSet | YE_INTRAMETASTATIC_HCC_UP |
| Enrichment Score (ES) | 0.5464957 |
| Normalized Enrichment Score (NES) | 1.7139844 |
| Nominal p-value | 0.0151802655 |
| FDR q-value | 0.32686177 |
| FWER p-Value | 0.999 |
| PROBE | GENE SYMBOL | GENE_TITLE | RANK IN GENE LIST | RANK METRIC SCORE | RUNNING ES | CORE ENRICHMENT | |
|---|---|---|---|---|---|---|---|
| 1 | IL2RB | 172 | 3.334 | 0.1106 | Yes | ||
| 2 | KHK | 471 | 2.763 | 0.1940 | Yes | ||
| 3 | ASPH | 764 | 2.461 | 0.2668 | Yes | ||
| 4 | FZD2 | 957 | 2.314 | 0.3397 | Yes | ||
| 5 | IGFBP6 | 1182 | 2.174 | 0.4058 | Yes | ||
| 6 | CD37 | 2417 | 1.683 | 0.3999 | Yes | ||
| 7 | CENPE | 3121 | 1.491 | 0.4158 | Yes | ||
| 8 | NR1D1 | 3151 | 1.482 | 0.4675 | Yes | ||
| 9 | ENO3 | 3437 | 1.410 | 0.5028 | Yes | ||
| 10 | MDFI | 3553 | 1.386 | 0.5465 | Yes | ||
| 11 | MMP9 | 8581 | 0.419 | 0.2913 | No | ||
| 12 | SERPINB5 | 11141 | -0.123 | 0.1581 | No | ||
| 13 | YES1 | 11691 | -0.248 | 0.1375 | No | ||
| 14 | INPP5B | 13398 | -0.690 | 0.0706 | No | ||
| 15 | CES1 | 14441 | -1.009 | 0.0508 | No | ||
| 16 | ITGA9 | 14826 | -1.143 | 0.0713 | No | ||
| 17 | IRF2 | 16448 | -1.830 | 0.0499 | No | ||
| 18 | LRP6 | 16492 | -1.852 | 0.1142 | No |
