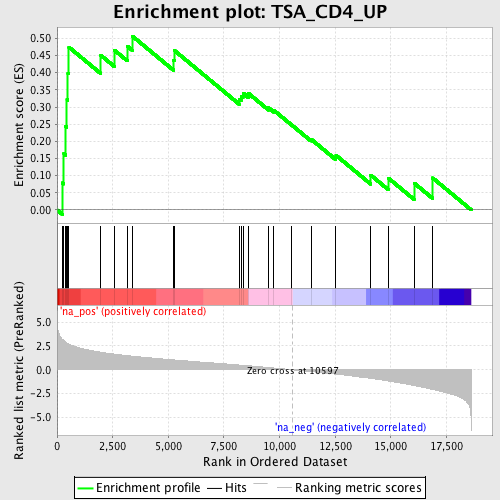
Profile of the Running ES Score & Positions of GeneSet Members on the Rank Ordered List
| Dataset | set03_truncNotch_versus_wtNotch |
| Phenotype | NoPhenotypeAvailable |
| Upregulated in class | na_pos |
| GeneSet | TSA_CD4_UP |
| Enrichment Score (ES) | 0.5065173 |
| Normalized Enrichment Score (NES) | 1.6911424 |
| Nominal p-value | 0.0019047619 |
| FDR q-value | 0.3705868 |
| FWER p-Value | 1.0 |
| PROBE | GENE SYMBOL | GENE_TITLE | RANK IN GENE LIST | RANK METRIC SCORE | RUNNING ES | CORE ENRICHMENT | |
|---|---|---|---|---|---|---|---|
| 1 | CD82 | 244 | 3.167 | 0.0788 | Yes | ||
| 2 | USF2 | 304 | 3.032 | 0.1636 | Yes | ||
| 3 | MIF | 388 | 2.894 | 0.2431 | Yes | ||
| 4 | STRA13 | 443 | 2.794 | 0.3213 | Yes | ||
| 5 | CD6 | 486 | 2.744 | 0.3987 | Yes | ||
| 6 | BAK1 | 530 | 2.689 | 0.4744 | Yes | ||
| 7 | CD2 | 1963 | 1.839 | 0.4507 | Yes | ||
| 8 | COX8A | 2569 | 1.643 | 0.4659 | Yes | ||
| 9 | SSR4 | 3161 | 1.479 | 0.4770 | Yes | ||
| 10 | IGFBP4 | 3381 | 1.423 | 0.5065 | Yes | ||
| 11 | FKBP4 | 5237 | 1.034 | 0.4367 | No | ||
| 12 | ITGB4BP | 5287 | 1.026 | 0.4639 | No | ||
| 13 | PA2G4 | 8183 | 0.495 | 0.3226 | No | ||
| 14 | BYSL | 8275 | 0.478 | 0.3315 | No | ||
| 15 | TGFB1 | 8358 | 0.463 | 0.3406 | No | ||
| 16 | TMSB4X | 8596 | 0.417 | 0.3399 | No | ||
| 17 | TP53 | 9507 | 0.232 | 0.2977 | No | ||
| 18 | PSMB4 | 9741 | 0.181 | 0.2904 | No | ||
| 19 | RARA | 10544 | 0.010 | 0.2476 | No | ||
| 20 | YWHAH | 11414 | -0.188 | 0.2063 | No | ||
| 21 | ENO2 | 12533 | -0.456 | 0.1594 | No | ||
| 22 | MYC | 14099 | -0.902 | 0.1014 | No | ||
| 23 | HMGN1 | 14895 | -1.165 | 0.0925 | No | ||
| 24 | HSP90AB1 | 16049 | -1.648 | 0.0783 | No | ||
| 25 | EIF4A1 | 16881 | -2.057 | 0.0933 | No |
