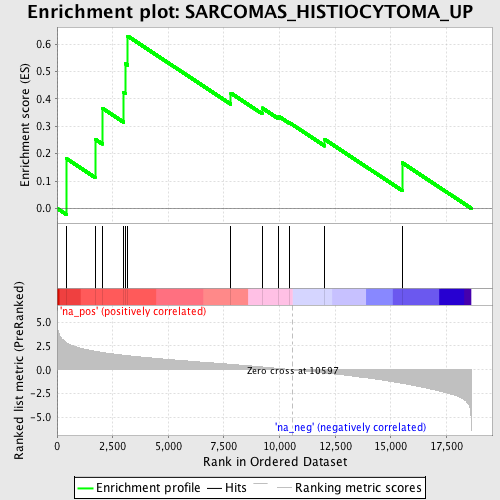
Profile of the Running ES Score & Positions of GeneSet Members on the Rank Ordered List
| Dataset | set03_truncNotch_versus_wtNotch |
| Phenotype | NoPhenotypeAvailable |
| Upregulated in class | na_pos |
| GeneSet | SARCOMAS_HISTIOCYTOMA_UP |
| Enrichment Score (ES) | 0.6295627 |
| Normalized Enrichment Score (NES) | 1.7301093 |
| Nominal p-value | 0.0116054155 |
| FDR q-value | 0.39569452 |
| FWER p-Value | 0.993 |
| PROBE | GENE SYMBOL | GENE_TITLE | RANK IN GENE LIST | RANK METRIC SCORE | RUNNING ES | CORE ENRICHMENT | |
|---|---|---|---|---|---|---|---|
| 1 | PLAU | 414 | 2.833 | 0.1822 | Yes | ||
| 2 | SH3BGRL3 | 1709 | 1.940 | 0.2527 | Yes | ||
| 3 | COL6A3 | 2037 | 1.811 | 0.3658 | Yes | ||
| 4 | LIF | 2994 | 1.523 | 0.4244 | Yes | ||
| 5 | TIMP1 | 3067 | 1.504 | 0.5290 | Yes | ||
| 6 | CCL7 | 3176 | 1.474 | 0.6296 | Yes | ||
| 7 | CXCL1 | 7810 | 0.565 | 0.4213 | No | ||
| 8 | SRPX | 9217 | 0.294 | 0.3670 | No | ||
| 9 | THBS2 | 9967 | 0.134 | 0.3364 | No | ||
| 10 | LOX | 10439 | 0.033 | 0.3135 | No | ||
| 11 | CCL2 | 12032 | -0.332 | 0.2519 | No | ||
| 12 | BST1 | 15518 | -1.413 | 0.1665 | No |
