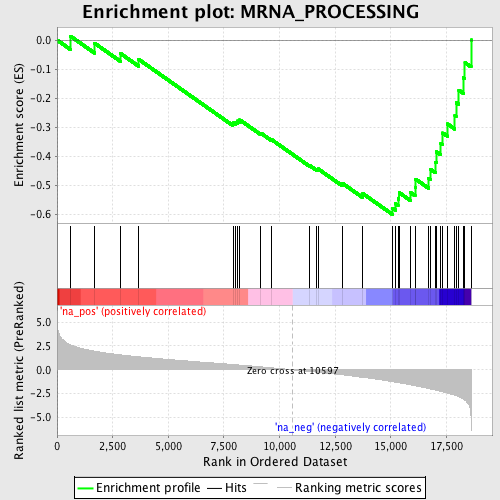
Profile of the Running ES Score & Positions of GeneSet Members on the Rank Ordered List
| Dataset | set03_truncNotch_versus_wtNotch |
| Phenotype | NoPhenotypeAvailable |
| Upregulated in class | na_neg |
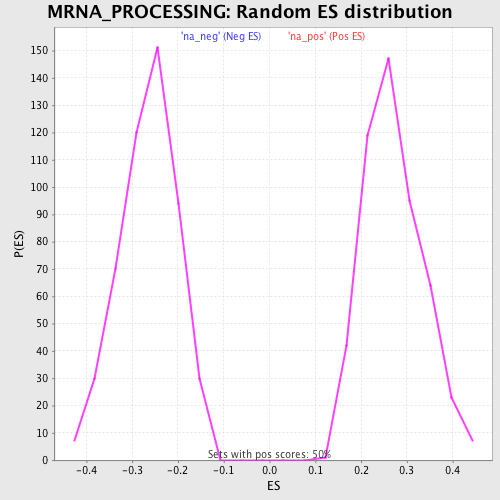
| GeneSet | MRNA_PROCESSING |
| Enrichment Score (ES) | -0.599792 |
| Normalized Enrichment Score (NES) | -2.2779138 |
| Nominal p-value | 0.0 |
| FDR q-value | 4.600123E-4 |
| FWER p-Value | 0.0060 |
| PROBE | GENE SYMBOL | GENE_TITLE | RANK IN GENE LIST | RANK METRIC SCORE | RUNNING ES | CORE ENRICHMENT | |
|---|---|---|---|---|---|---|---|
| 1 | SFRS8 | 597 | 2.619 | 0.0137 | No | ||
| 2 | U2AF2 | 1684 | 1.950 | -0.0107 | No | ||
| 3 | HNRPA0 | 2856 | 1.560 | -0.0464 | No | ||
| 4 | HNRPR | 3667 | 1.360 | -0.0663 | No | ||
| 5 | LSM3 | 7905 | 0.547 | -0.2847 | No | ||
| 6 | U2AF1 | 8030 | 0.525 | -0.2822 | No | ||
| 7 | ELAVL4 | 8121 | 0.507 | -0.2782 | No | ||
| 8 | SF3B4 | 8215 | 0.489 | -0.2746 | No | ||
| 9 | SNRP70 | 9162 | 0.307 | -0.3202 | No | ||
| 10 | LSM5 | 9635 | 0.202 | -0.3420 | No | ||
| 11 | SFRS9 | 11352 | -0.172 | -0.4314 | No | ||
| 12 | NONO | 11657 | -0.241 | -0.4435 | No | ||
| 13 | SNRPB2 | 11731 | -0.260 | -0.4429 | No | ||
| 14 | PTBP1 | 12809 | -0.523 | -0.4917 | No | ||
| 15 | SIP1 | 13741 | -0.797 | -0.5279 | No | ||
| 16 | SF3A1 | 15078 | -1.237 | -0.5782 | Yes | ||
| 17 | SFRS7 | 15210 | -1.289 | -0.5627 | Yes | ||
| 18 | FUSIP1 | 15328 | -1.334 | -0.5457 | Yes | ||
| 19 | SLBP | 15367 | -1.349 | -0.5241 | Yes | ||
| 20 | SFRS5 | 15877 | -1.569 | -0.5241 | Yes | ||
| 21 | PRPF8 | 16092 | -1.668 | -0.5064 | Yes | ||
| 22 | SF3B3 | 16119 | -1.680 | -0.4785 | Yes | ||
| 23 | SFRS10 | 16701 | -1.959 | -0.4755 | Yes | ||
| 24 | KHDRBS1 | 16794 | -2.018 | -0.4452 | Yes | ||
| 25 | SPOP | 17008 | -2.123 | -0.4195 | Yes | ||
| 26 | HNRPA1 | 17053 | -2.147 | -0.3843 | Yes | ||
| 27 | USP39 | 17247 | -2.259 | -0.3552 | Yes | ||
| 28 | SF3A3 | 17334 | -2.311 | -0.3195 | Yes | ||
| 29 | SFRS2 | 17548 | -2.439 | -0.2883 | Yes | ||
| 30 | CUGBP1 | 17880 | -2.670 | -0.2594 | Yes | ||
| 31 | SFRS2IP | 17936 | -2.710 | -0.2150 | Yes | ||
| 32 | DHX15 | 18058 | -2.822 | -0.1722 | Yes | ||
| 33 | SFPQ | 18263 | -3.078 | -0.1294 | Yes | ||
| 34 | SFRS1 | 18333 | -3.183 | -0.0774 | Yes | ||
| 35 | PRPF3 | 18608 | -5.298 | 0.0004 | Yes |