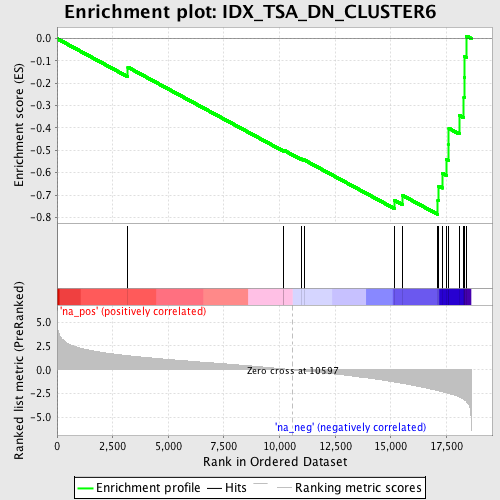
Profile of the Running ES Score & Positions of GeneSet Members on the Rank Ordered List
| Dataset | set03_truncNotch_versus_wtNotch |
| Phenotype | NoPhenotypeAvailable |
| Upregulated in class | na_neg |
| GeneSet | IDX_TSA_DN_CLUSTER6 |
| Enrichment Score (ES) | -0.7871418 |
| Normalized Enrichment Score (NES) | -2.4577875 |
| Nominal p-value | 0.0 |
| FDR q-value | 0.0 |
| FWER p-Value | 0.0 |
| PROBE | GENE SYMBOL | GENE_TITLE | RANK IN GENE LIST | RANK METRIC SCORE | RUNNING ES | CORE ENRICHMENT | |
|---|---|---|---|---|---|---|---|
| 1 | DNAJC3 | 3183 | 1.472 | -0.1280 | No | ||
| 2 | POLN | 10188 | 0.087 | -0.5020 | No | ||
| 3 | BUB1 | 10189 | 0.087 | -0.4995 | No | ||
| 4 | SP3 | 10964 | -0.086 | -0.5386 | No | ||
| 5 | CYP1B1 | 11108 | -0.115 | -0.5429 | No | ||
| 6 | PHF12 | 15154 | -1.268 | -0.7233 | Yes | ||
| 7 | KIF2A | 15533 | -1.417 | -0.7021 | Yes | ||
| 8 | PUM2 | 17116 | -2.184 | -0.7232 | Yes | ||
| 9 | ARID1A | 17156 | -2.208 | -0.6606 | Yes | ||
| 10 | IREB2 | 17308 | -2.294 | -0.6015 | Yes | ||
| 11 | MKI67 | 17504 | -2.413 | -0.5413 | Yes | ||
| 12 | HNRPM | 17604 | -2.479 | -0.4740 | Yes | ||
| 13 | MYEF2 | 17611 | -2.483 | -0.4016 | Yes | ||
| 14 | ZNF638 | 18075 | -2.833 | -0.3435 | Yes | ||
| 15 | SRPK2 | 18286 | -3.115 | -0.2636 | Yes | ||
| 16 | ROCK1 | 18302 | -3.134 | -0.1726 | Yes | ||
| 17 | ROD1 | 18313 | -3.150 | -0.0808 | Yes | ||
| 18 | CAPN7 | 18406 | -3.313 | 0.0113 | Yes |
