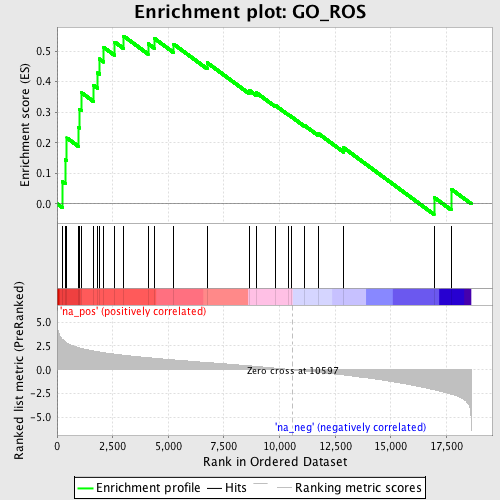
Profile of the Running ES Score & Positions of GeneSet Members on the Rank Ordered List
| Dataset | set03_truncNotch_versus_wtNotch |
| Phenotype | NoPhenotypeAvailable |
| Upregulated in class | na_pos |
| GeneSet | GO_ROS |
| Enrichment Score (ES) | 0.5492198 |
| Normalized Enrichment Score (NES) | 1.8742822 |
| Nominal p-value | 0.0 |
| FDR q-value | 0.47205913 |
| FWER p-Value | 0.678 |
| PROBE | GENE SYMBOL | GENE_TITLE | RANK IN GENE LIST | RANK METRIC SCORE | RUNNING ES | CORE ENRICHMENT | |
|---|---|---|---|---|---|---|---|
| 1 | DUSP1 | 234 | 3.185 | 0.0730 | Yes | ||
| 2 | STK25 | 366 | 2.926 | 0.1446 | Yes | ||
| 3 | PDLIM1 | 442 | 2.796 | 0.2158 | Yes | ||
| 4 | GPX3 | 962 | 2.306 | 0.2498 | Yes | ||
| 5 | MTL5 | 995 | 2.285 | 0.3095 | Yes | ||
| 6 | SCARA3 | 1089 | 2.232 | 0.3645 | Yes | ||
| 7 | GSS | 1643 | 1.966 | 0.3876 | Yes | ||
| 8 | CYBA | 1826 | 1.896 | 0.4288 | Yes | ||
| 9 | FOXM1 | 1904 | 1.859 | 0.4746 | Yes | ||
| 10 | MSRA | 2097 | 1.788 | 0.5124 | Yes | ||
| 11 | NCF2 | 2593 | 1.637 | 0.5297 | Yes | ||
| 12 | AOX1 | 2993 | 1.523 | 0.5492 | Yes | ||
| 13 | CCL5 | 4090 | 1.272 | 0.5244 | No | ||
| 14 | MPO | 4378 | 1.204 | 0.5414 | No | ||
| 15 | PRDX2 | 5243 | 1.033 | 0.5227 | No | ||
| 16 | LTC4S | 6748 | 0.755 | 0.4621 | No | ||
| 17 | NUDT1 | 8632 | 0.412 | 0.3719 | No | ||
| 18 | SOD1 | 8956 | 0.352 | 0.3640 | No | ||
| 19 | ATOX1 | 9824 | 0.161 | 0.3216 | No | ||
| 20 | NCF1 | 10381 | 0.046 | 0.2930 | No | ||
| 21 | CCS | 10550 | 0.009 | 0.2842 | No | ||
| 22 | SEPP1 | 11113 | -0.115 | 0.2571 | No | ||
| 23 | SGK2 | 11756 | -0.264 | 0.2296 | No | ||
| 24 | SOD2 | 12878 | -0.540 | 0.1839 | No | ||
| 25 | RPS6KA5 | 16943 | -2.089 | 0.0214 | No | ||
| 26 | OSR1 | 17713 | -2.549 | 0.0486 | No |
