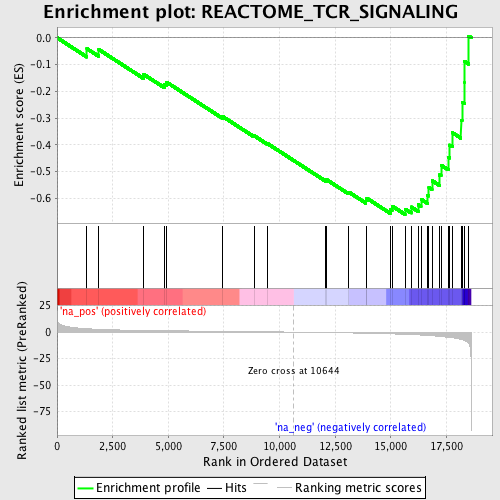
Profile of the Running ES Score & Positions of GeneSet Members on the Rank Ordered List
| Dataset | set03_truncNotch_versus_normalThy |
| Phenotype | NoPhenotypeAvailable |
| Upregulated in class | na_neg |
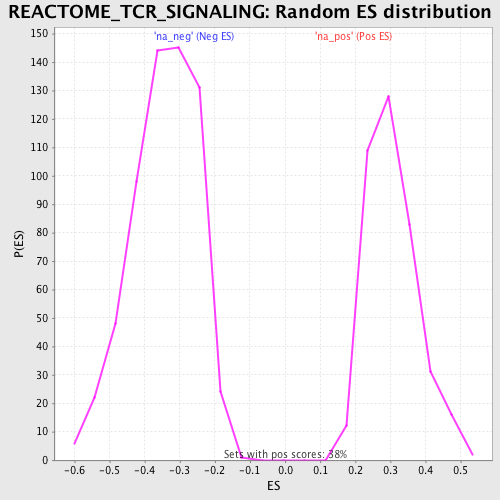
| GeneSet | REACTOME_TCR_SIGNALING |
| Enrichment Score (ES) | -0.66030324 |
| Normalized Enrichment Score (NES) | -1.9266496 |
| Nominal p-value | 0.0 |
| FDR q-value | 0.056282934 |
| FWER p-Value | 0.479 |
| PROBE | GENE SYMBOL | GENE_TITLE | RANK IN GENE LIST | RANK METRIC SCORE | RUNNING ES | CORE ENRICHMENT | |
|---|---|---|---|---|---|---|---|
| 1 | ZAP70 | 1339 | 3.169 | -0.0409 | No | ||
| 2 | GRAP2 | 1874 | 2.611 | -0.0440 | No | ||
| 3 | ENAH | 3884 | 1.601 | -0.1364 | No | ||
| 4 | NFKB1 | 4832 | 1.341 | -0.1741 | No | ||
| 5 | PIK3R1 | 4924 | 1.317 | -0.1661 | No | ||
| 6 | NCK1 | 7424 | 0.736 | -0.2933 | No | ||
| 7 | PTPRC | 8852 | 0.434 | -0.3658 | No | ||
| 8 | PLCG1 | 9454 | 0.300 | -0.3952 | No | ||
| 9 | UBE2N | 12079 | -0.402 | -0.5325 | No | ||
| 10 | CSK | 12109 | -0.409 | -0.5300 | No | ||
| 11 | CD3D | 13106 | -0.739 | -0.5763 | No | ||
| 12 | FYB | 13884 | -1.041 | -0.6079 | No | ||
| 13 | MAP3K7 | 13920 | -1.056 | -0.5994 | No | ||
| 14 | LAT | 14974 | -1.587 | -0.6405 | Yes | ||
| 15 | PAK1 | 15056 | -1.632 | -0.6288 | Yes | ||
| 16 | LCK | 15642 | -2.053 | -0.6401 | Yes | ||
| 17 | IKBKB | 15915 | -2.297 | -0.6322 | Yes | ||
| 18 | CHUK | 16242 | -2.624 | -0.6240 | Yes | ||
| 19 | PTEN | 16358 | -2.734 | -0.6033 | Yes | ||
| 20 | CD3G | 16658 | -3.129 | -0.5886 | Yes | ||
| 21 | RELA | 16711 | -3.206 | -0.5599 | Yes | ||
| 22 | NFKBIA | 16853 | -3.436 | -0.5338 | Yes | ||
| 23 | PIK3CB | 17185 | -3.980 | -0.5125 | Yes | ||
| 24 | WAS | 17259 | -4.085 | -0.4762 | Yes | ||
| 25 | BCL10 | 17583 | -4.820 | -0.4463 | Yes | ||
| 26 | PRKCQ | 17644 | -4.969 | -0.4007 | Yes | ||
| 27 | RIPK2 | 17775 | -5.360 | -0.3550 | Yes | ||
| 28 | LCP2 | 18154 | -6.845 | -0.3081 | Yes | ||
| 29 | CD3E | 18203 | -7.143 | -0.2405 | Yes | ||
| 30 | PDPK1 | 18310 | -8.013 | -0.1675 | Yes | ||
| 31 | CD4 | 18316 | -8.053 | -0.0886 | Yes | ||
| 32 | ITK | 18503 | -10.655 | 0.0061 | Yes |