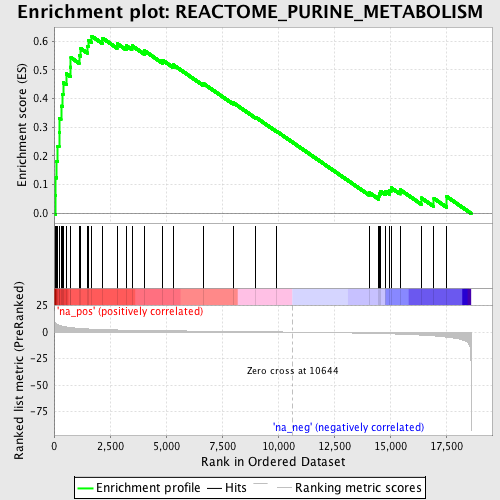
Profile of the Running ES Score & Positions of GeneSet Members on the Rank Ordered List
| Dataset | set03_truncNotch_versus_normalThy |
| Phenotype | NoPhenotypeAvailable |
| Upregulated in class | na_pos |
| GeneSet | REACTOME_PURINE_METABOLISM |
| Enrichment Score (ES) | 0.6172046 |
| Normalized Enrichment Score (NES) | 2.0625582 |
| Nominal p-value | 0.0 |
| FDR q-value | 0.0018247294 |
| FWER p-Value | 0.015 |
| PROBE | GENE SYMBOL | GENE_TITLE | RANK IN GENE LIST | RANK METRIC SCORE | RUNNING ES | CORE ENRICHMENT | |
|---|---|---|---|---|---|---|---|
| 1 | NME2 | 67 | 8.379 | 0.0629 | Yes | ||
| 2 | GUK1 | 79 | 7.894 | 0.1249 | Yes | ||
| 3 | ATIC | 112 | 7.466 | 0.1824 | Yes | ||
| 4 | AMPD2 | 160 | 6.908 | 0.2347 | Yes | ||
| 5 | ATP5E | 223 | 6.409 | 0.2822 | Yes | ||
| 6 | ATP5G1 | 233 | 6.288 | 0.3316 | Yes | ||
| 7 | IMPDH2 | 309 | 5.850 | 0.3740 | Yes | ||
| 8 | ADSL | 373 | 5.537 | 0.4146 | Yes | ||
| 9 | APRT | 403 | 5.382 | 0.4557 | Yes | ||
| 10 | GART | 548 | 4.794 | 0.4860 | Yes | ||
| 11 | NME1 | 736 | 4.265 | 0.5098 | Yes | ||
| 12 | ATP5D | 750 | 4.224 | 0.5426 | Yes | ||
| 13 | AMPD3 | 1116 | 3.499 | 0.5507 | Yes | ||
| 14 | PPAT | 1190 | 3.393 | 0.5737 | Yes | ||
| 15 | NP | 1480 | 3.007 | 0.5820 | Yes | ||
| 16 | ADK | 1525 | 2.956 | 0.6031 | Yes | ||
| 17 | GMPS | 1676 | 2.800 | 0.6172 | Yes | ||
| 18 | ATP5O | 2159 | 2.387 | 0.6102 | No | ||
| 19 | ATP5I | 2811 | 2.013 | 0.5911 | No | ||
| 20 | ATP5F1 | 3220 | 1.832 | 0.5837 | No | ||
| 21 | AK1 | 3478 | 1.735 | 0.5836 | No | ||
| 22 | PAICS | 4027 | 1.560 | 0.5665 | No | ||
| 23 | ATP5J | 4847 | 1.336 | 0.5330 | No | ||
| 24 | ATP5A1 | 5317 | 1.218 | 0.5174 | No | ||
| 25 | HPRT1 | 6649 | 0.904 | 0.4530 | No | ||
| 26 | ATP5J2 | 7995 | 0.616 | 0.3855 | No | ||
| 27 | RRM1 | 9003 | 0.401 | 0.3344 | No | ||
| 28 | ATP5C1 | 9944 | 0.189 | 0.2853 | No | ||
| 29 | ATP5H | 14062 | -1.122 | 0.0726 | No | ||
| 30 | DGUOK | 14496 | -1.326 | 0.0598 | No | ||
| 31 | NT5C2 | 14508 | -1.330 | 0.0698 | No | ||
| 32 | ADSSL1 | 14560 | -1.354 | 0.0778 | No | ||
| 33 | XDH | 14793 | -1.482 | 0.0771 | No | ||
| 34 | ATP5B | 14979 | -1.593 | 0.0797 | No | ||
| 35 | ADA | 15042 | -1.625 | 0.0893 | No | ||
| 36 | TXNRD1 | 15445 | -1.901 | 0.0828 | No | ||
| 37 | IMPDH1 | 16390 | -2.786 | 0.0540 | No | ||
| 38 | AMPD1 | 16954 | -3.576 | 0.0521 | No | ||
| 39 | RRM2 | 17528 | -4.701 | 0.0586 | No |
