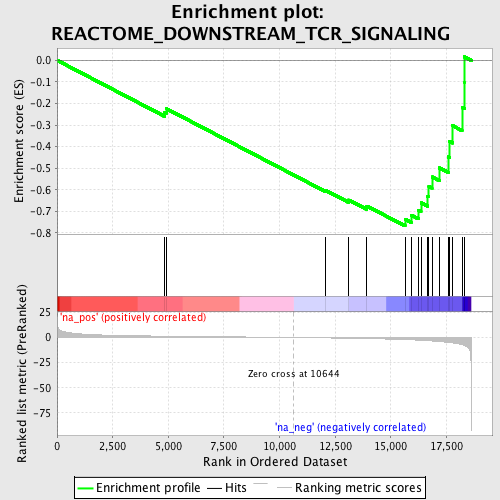
Profile of the Running ES Score & Positions of GeneSet Members on the Rank Ordered List
| Dataset | set03_truncNotch_versus_normalThy |
| Phenotype | NoPhenotypeAvailable |
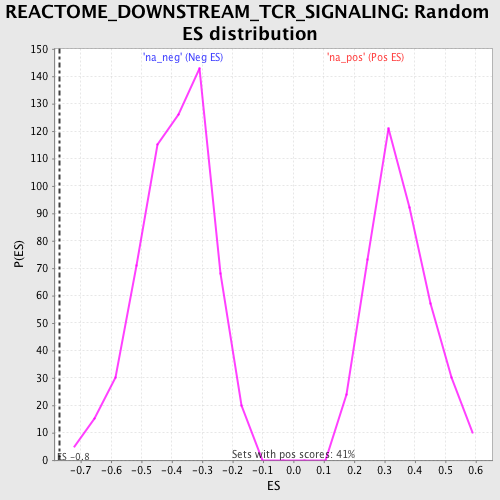
| Upregulated in class | na_neg |
| GeneSet | REACTOME_DOWNSTREAM_TCR_SIGNALING |
| Enrichment Score (ES) | -0.7679794 |
| Normalized Enrichment Score (NES) | -1.974966 |
| Nominal p-value | 0.0 |
| FDR q-value | 0.05087749 |
| FWER p-Value | 0.325 |
| PROBE | GENE SYMBOL | GENE_TITLE | RANK IN GENE LIST | RANK METRIC SCORE | RUNNING ES | CORE ENRICHMENT | |
|---|---|---|---|---|---|---|---|
| 1 | NFKB1 | 4832 | 1.341 | -0.2397 | No | ||
| 2 | PIK3R1 | 4924 | 1.317 | -0.2248 | No | ||
| 3 | UBE2N | 12079 | -0.402 | -0.6035 | No | ||
| 4 | CD3D | 13106 | -0.739 | -0.6476 | No | ||
| 5 | MAP3K7 | 13920 | -1.056 | -0.6754 | No | ||
| 6 | LCK | 15642 | -2.053 | -0.7372 | Yes | ||
| 7 | IKBKB | 15915 | -2.297 | -0.7174 | Yes | ||
| 8 | CHUK | 16242 | -2.624 | -0.6955 | Yes | ||
| 9 | PTEN | 16358 | -2.734 | -0.6607 | Yes | ||
| 10 | CD3G | 16658 | -3.129 | -0.6298 | Yes | ||
| 11 | RELA | 16711 | -3.206 | -0.5846 | Yes | ||
| 12 | NFKBIA | 16853 | -3.436 | -0.5406 | Yes | ||
| 13 | PIK3CB | 17185 | -3.980 | -0.4987 | Yes | ||
| 14 | BCL10 | 17583 | -4.820 | -0.4478 | Yes | ||
| 15 | PRKCQ | 17644 | -4.969 | -0.3765 | Yes | ||
| 16 | RIPK2 | 17775 | -5.360 | -0.3031 | Yes | ||
| 17 | CD3E | 18203 | -7.143 | -0.2189 | Yes | ||
| 18 | PDPK1 | 18310 | -8.013 | -0.1044 | Yes | ||
| 19 | CD4 | 18316 | -8.053 | 0.0161 | Yes |