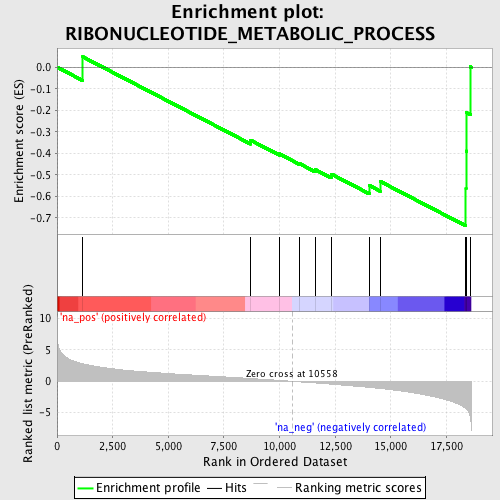
Profile of the Running ES Score & Positions of GeneSet Members on the Rank Ordered List
| Dataset | set03_truncNotch_versus_absentNotch |
| Phenotype | NoPhenotypeAvailable |
| Upregulated in class | na_neg |
| GeneSet | RIBONUCLEOTIDE_METABOLIC_PROCESS |
| Enrichment Score (ES) | -0.7382321 |
| Normalized Enrichment Score (NES) | -2.0031352 |
| Nominal p-value | 0.0 |
| FDR q-value | 0.021004803 |
| FWER p-Value | 0.192 |
| PROBE | GENE SYMBOL | GENE_TITLE | RANK IN GENE LIST | RANK METRIC SCORE | RUNNING ES | CORE ENRICHMENT | |
|---|---|---|---|---|---|---|---|
| 1 | AMPD3 | 1155 | 2.783 | 0.0482 | No | ||
| 2 | AK5 | 8699 | 0.445 | -0.3396 | No | ||
| 3 | GUK1 | 9986 | 0.145 | -0.4029 | No | ||
| 4 | ENTPD4 | 10893 | -0.085 | -0.4483 | No | ||
| 5 | NDUFS1 | 11605 | -0.261 | -0.4761 | No | ||
| 6 | NUDT5 | 12320 | -0.451 | -0.4966 | No | ||
| 7 | UMPS | 14042 | -0.972 | -0.5506 | No | ||
| 8 | CTNS | 14522 | -1.143 | -0.5310 | No | ||
| 9 | ADK | 18378 | -4.388 | -0.5643 | Yes | ||
| 10 | CTPS | 18382 | -4.412 | -0.3895 | Yes | ||
| 11 | FIGNL1 | 18411 | -4.514 | -0.2121 | Yes | ||
| 12 | ACLY | 18574 | -5.627 | 0.0023 | Yes |
