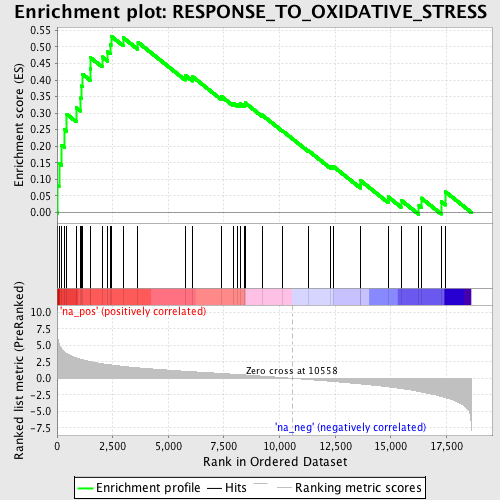
Profile of the Running ES Score & Positions of GeneSet Members on the Rank Ordered List
| Dataset | set03_truncNotch_versus_absentNotch |
| Phenotype | NoPhenotypeAvailable |
| Upregulated in class | na_pos |
| GeneSet | RESPONSE_TO_OXIDATIVE_STRESS |
| Enrichment Score (ES) | 0.5326341 |
| Normalized Enrichment Score (NES) | 1.9107484 |
| Nominal p-value | 0.0 |
| FDR q-value | 0.070863 |
| FWER p-Value | 0.373 |
| PROBE | GENE SYMBOL | GENE_TITLE | RANK IN GENE LIST | RANK METRIC SCORE | RUNNING ES | CORE ENRICHMENT | |
|---|---|---|---|---|---|---|---|
| 1 | PNKP | 36 | 6.008 | 0.0804 | Yes | ||
| 2 | TXNRD2 | 87 | 5.172 | 0.1486 | Yes | ||
| 3 | ERCC1 | 208 | 4.452 | 0.2031 | Yes | ||
| 4 | STK25 | 344 | 3.986 | 0.2505 | Yes | ||
| 5 | GSS | 439 | 3.726 | 0.2965 | Yes | ||
| 6 | GPX3 | 863 | 3.079 | 0.3159 | Yes | ||
| 7 | NDUFS8 | 1044 | 2.883 | 0.3458 | Yes | ||
| 8 | PDLIM1 | 1093 | 2.838 | 0.3821 | Yes | ||
| 9 | DHCR24 | 1150 | 2.791 | 0.4173 | Yes | ||
| 10 | ERCC8 | 1486 | 2.534 | 0.4340 | Yes | ||
| 11 | ERCC2 | 1515 | 2.512 | 0.4669 | Yes | ||
| 12 | SCARA3 | 2026 | 2.210 | 0.4698 | Yes | ||
| 13 | MSRA | 2273 | 2.086 | 0.4851 | Yes | ||
| 14 | PRDX6 | 2389 | 2.035 | 0.5068 | Yes | ||
| 15 | PRDX2 | 2425 | 2.023 | 0.5326 | Yes | ||
| 16 | PRDX5 | 2971 | 1.791 | 0.5278 | No | ||
| 17 | ATOX1 | 3634 | 1.587 | 0.5140 | No | ||
| 18 | MPO | 5753 | 1.064 | 0.4145 | No | ||
| 19 | SOD1 | 6082 | 0.997 | 0.4105 | No | ||
| 20 | ERCC3 | 7393 | 0.729 | 0.3500 | No | ||
| 21 | NDUFB4 | 7917 | 0.619 | 0.3304 | No | ||
| 22 | SOD2 | 8129 | 0.572 | 0.3269 | No | ||
| 23 | NDUFS2 | 8236 | 0.549 | 0.3287 | No | ||
| 24 | NUDT1 | 8423 | 0.507 | 0.3256 | No | ||
| 25 | APOA4 | 8445 | 0.501 | 0.3313 | No | ||
| 26 | APTX | 9213 | 0.320 | 0.2944 | No | ||
| 27 | DUSP1 | 10152 | 0.107 | 0.2454 | No | ||
| 28 | SGK2 | 11282 | -0.184 | 0.1872 | No | ||
| 29 | GCLC | 12291 | -0.445 | 0.1390 | No | ||
| 30 | RNF7 | 12412 | -0.478 | 0.1391 | No | ||
| 31 | CYGB | 13630 | -0.837 | 0.0851 | No | ||
| 32 | NDUFA6 | 13636 | -0.841 | 0.0963 | No | ||
| 33 | GLRX2 | 14881 | -1.282 | 0.0469 | No | ||
| 34 | SRXN1 | 15461 | -1.543 | 0.0369 | No | ||
| 35 | GCLM | 16263 | -1.976 | 0.0209 | No | ||
| 36 | CCL5 | 16364 | -2.051 | 0.0436 | No | ||
| 37 | PRNP | 17266 | -2.742 | 0.0327 | No | ||
| 38 | SEPP1 | 17460 | -2.913 | 0.0622 | No |
