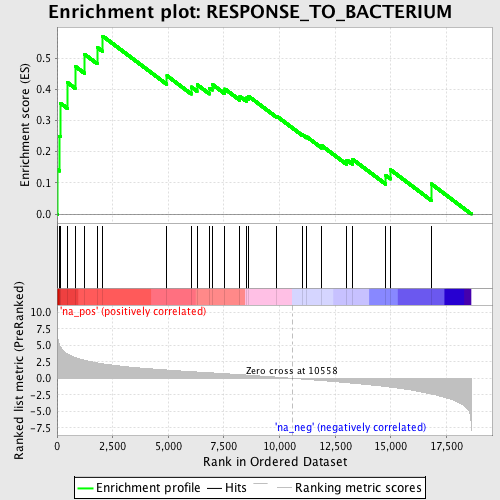
Profile of the Running ES Score & Positions of GeneSet Members on the Rank Ordered List
| Dataset | set03_truncNotch_versus_absentNotch |
| Phenotype | NoPhenotypeAvailable |
| Upregulated in class | na_pos |
| GeneSet | RESPONSE_TO_BACTERIUM |
| Enrichment Score (ES) | 0.5707367 |
| Normalized Enrichment Score (NES) | 1.83896 |
| Nominal p-value | 0.0038387715 |
| FDR q-value | 0.109058864 |
| FWER p-Value | 0.654 |
| PROBE | GENE SYMBOL | GENE_TITLE | RANK IN GENE LIST | RANK METRIC SCORE | RUNNING ES | CORE ENRICHMENT | |
|---|---|---|---|---|---|---|---|
| 1 | PGLYRP2 | 27 | 6.378 | 0.1422 | Yes | ||
| 2 | SPN | 109 | 4.985 | 0.2501 | Yes | ||
| 3 | NOD1 | 148 | 4.780 | 0.3558 | Yes | ||
| 4 | PGLYRP4 | 462 | 3.688 | 0.4220 | Yes | ||
| 5 | IL10 | 810 | 3.137 | 0.4740 | Yes | ||
| 6 | DMBT1 | 1235 | 2.724 | 0.5126 | Yes | ||
| 7 | TLR6 | 1801 | 2.332 | 0.5347 | Yes | ||
| 8 | DEFB127 | 2051 | 2.195 | 0.5707 | Yes | ||
| 9 | CAMP | 4937 | 1.252 | 0.4438 | No | ||
| 10 | SLC11A1 | 6032 | 1.009 | 0.4076 | No | ||
| 11 | DEFB103A | 6290 | 0.954 | 0.4153 | No | ||
| 12 | SPACA3 | 6855 | 0.838 | 0.4038 | No | ||
| 13 | PGLYRP1 | 6969 | 0.818 | 0.4162 | No | ||
| 14 | WFDC12 | 7542 | 0.697 | 0.4011 | No | ||
| 15 | TLR3 | 8215 | 0.553 | 0.3774 | No | ||
| 16 | LALBA | 8514 | 0.489 | 0.3724 | No | ||
| 17 | STAB1 | 8597 | 0.468 | 0.3785 | No | ||
| 18 | STAB2 | 9874 | 0.171 | 0.3137 | No | ||
| 19 | NOD2 | 11013 | -0.116 | 0.2551 | No | ||
| 20 | CHIT1 | 11223 | -0.166 | 0.2476 | No | ||
| 21 | NLRC4 | 11895 | -0.342 | 0.2192 | No | ||
| 22 | BCL10 | 13021 | -0.647 | 0.1733 | No | ||
| 23 | PGLYRP3 | 13273 | -0.730 | 0.1762 | No | ||
| 24 | CFP | 14775 | -1.238 | 0.1234 | No | ||
| 25 | IL12A | 14982 | -1.327 | 0.1422 | No | ||
| 26 | CD24 | 16818 | -2.363 | 0.0967 | No |
