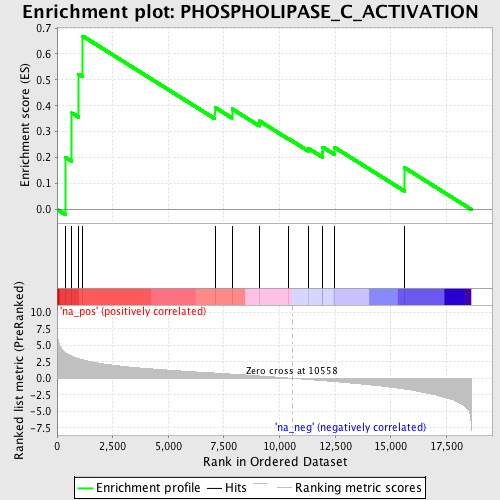
Profile of the Running ES Score & Positions of GeneSet Members on the Rank Ordered List
| Dataset | set03_truncNotch_versus_absentNotch |
| Phenotype | NoPhenotypeAvailable |
| Upregulated in class | na_pos |
| GeneSet | PHOSPHOLIPASE_C_ACTIVATION |
| Enrichment Score (ES) | 0.668718 |
| Normalized Enrichment Score (NES) | 1.8260115 |
| Nominal p-value | 0.001984127 |
| FDR q-value | 0.115584165 |
| FWER p-Value | 0.711 |
| PROBE | GENE SYMBOL | GENE_TITLE | RANK IN GENE LIST | RANK METRIC SCORE | RUNNING ES | CORE ENRICHMENT | |
|---|---|---|---|---|---|---|---|
| 1 | EDG4 | 360 | 3.934 | 0.2015 | Yes | ||
| 2 | EDG6 | 666 | 3.332 | 0.3723 | Yes | ||
| 3 | GNAQ | 974 | 2.964 | 0.5222 | Yes | ||
| 4 | EGFR | 1156 | 2.782 | 0.6687 | Yes | ||
| 5 | EDNRA | 7096 | 0.790 | 0.3939 | No | ||
| 6 | CCKBR | 7862 | 0.630 | 0.3881 | No | ||
| 7 | AVPR1A | 9094 | 0.347 | 0.3415 | No | ||
| 8 | AVPR1B | 10420 | 0.032 | 0.2721 | No | ||
| 9 | EDG2 | 11303 | -0.188 | 0.2352 | No | ||
| 10 | GNA15 | 11926 | -0.348 | 0.2213 | No | ||
| 11 | PLCB2 | 11943 | -0.352 | 0.2402 | No | ||
| 12 | C5AR1 | 12469 | -0.494 | 0.2397 | No | ||
| 13 | NMUR1 | 15615 | -1.614 | 0.1613 | No |
