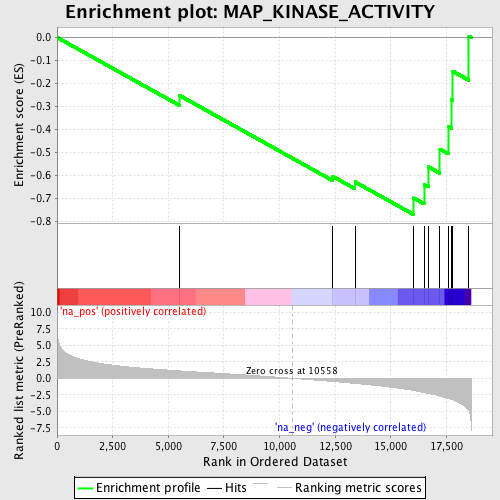
Profile of the Running ES Score & Positions of GeneSet Members on the Rank Ordered List
| Dataset | set03_truncNotch_versus_absentNotch |
| Phenotype | NoPhenotypeAvailable |
| Upregulated in class | na_neg |
| GeneSet | MAP_KINASE_ACTIVITY |
| Enrichment Score (ES) | -0.76935303 |
| Normalized Enrichment Score (NES) | -2.007583 |
| Nominal p-value | 0.0 |
| FDR q-value | 0.02122512 |
| FWER p-Value | 0.178 |
| PROBE | GENE SYMBOL | GENE_TITLE | RANK IN GENE LIST | RANK METRIC SCORE | RUNNING ES | CORE ENRICHMENT | |
|---|---|---|---|---|---|---|---|
| 1 | MAPK12 | 5484 | 1.119 | -0.2513 | No | ||
| 2 | MAPK4 | 12393 | -0.474 | -0.6041 | No | ||
| 3 | MAPK13 | 13389 | -0.767 | -0.6278 | No | ||
| 4 | MAPK7 | 16024 | -1.846 | -0.6976 | Yes | ||
| 5 | MAPK14 | 16495 | -2.137 | -0.6398 | Yes | ||
| 6 | NLK | 16679 | -2.261 | -0.5618 | Yes | ||
| 7 | MAPK10 | 17207 | -2.691 | -0.4856 | Yes | ||
| 8 | MAPK11 | 17586 | -3.057 | -0.3871 | Yes | ||
| 9 | MAPK1 | 17720 | -3.193 | -0.2702 | Yes | ||
| 10 | MAPK9 | 17768 | -3.255 | -0.1463 | Yes | ||
| 11 | MAPK8 | 18511 | -4.936 | 0.0056 | Yes |
