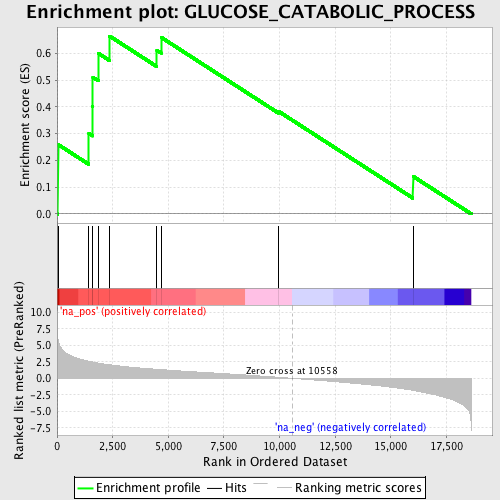
Profile of the Running ES Score & Positions of GeneSet Members on the Rank Ordered List
| Dataset | set03_truncNotch_versus_absentNotch |
| Phenotype | NoPhenotypeAvailable |
| Upregulated in class | na_pos |
| GeneSet | GLUCOSE_CATABOLIC_PROCESS |
| Enrichment Score (ES) | 0.6648674 |
| Normalized Enrichment Score (NES) | 1.6407117 |
| Nominal p-value | 0.013888889 |
| FDR q-value | 0.367206 |
| FWER p-Value | 1.0 |
| PROBE | GENE SYMBOL | GENE_TITLE | RANK IN GENE LIST | RANK METRIC SCORE | RUNNING ES | CORE ENRICHMENT | |
|---|---|---|---|---|---|---|---|
| 1 | ALDOA | 39 | 5.848 | 0.2598 | Yes | ||
| 2 | PGD | 1428 | 2.571 | 0.3004 | Yes | ||
| 3 | PFKM | 1598 | 2.460 | 0.4015 | Yes | ||
| 4 | PFKFB1 | 1609 | 2.453 | 0.5109 | Yes | ||
| 5 | GAPDHS | 1867 | 2.293 | 0.5998 | Yes | ||
| 6 | PFKL | 2361 | 2.045 | 0.6649 | Yes | ||
| 7 | PGLS | 4485 | 1.359 | 0.6117 | No | ||
| 8 | HK1 | 4677 | 1.314 | 0.6603 | No | ||
| 9 | ALDOB | 9949 | 0.153 | 0.3839 | No | ||
| 10 | TKTL1 | 15996 | -1.828 | 0.1408 | No |
