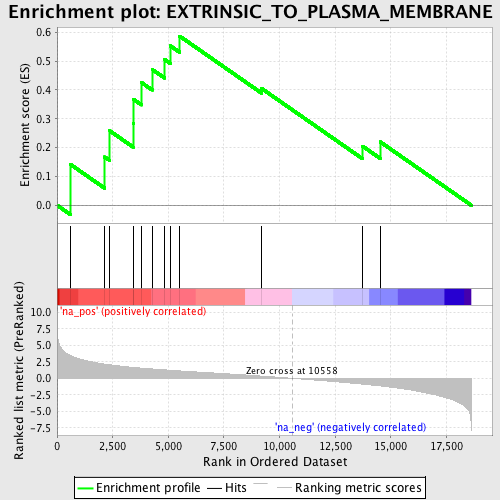
Profile of the Running ES Score & Positions of GeneSet Members on the Rank Ordered List
| Dataset | set03_truncNotch_versus_absentNotch |
| Phenotype | NoPhenotypeAvailable |
| Upregulated in class | na_pos |
| GeneSet | EXTRINSIC_TO_PLASMA_MEMBRANE |
| Enrichment Score (ES) | 0.58676094 |
| Normalized Enrichment Score (NES) | 1.6161295 |
| Nominal p-value | 0.028119508 |
| FDR q-value | 0.42460176 |
| FWER p-Value | 1.0 |
| PROBE | GENE SYMBOL | GENE_TITLE | RANK IN GENE LIST | RANK METRIC SCORE | RUNNING ES | CORE ENRICHMENT | |
|---|---|---|---|---|---|---|---|
| 1 | GNAS | 594 | 3.452 | 0.1421 | Yes | ||
| 2 | APC2 | 2135 | 2.150 | 0.1676 | Yes | ||
| 3 | ARRB1 | 2367 | 2.043 | 0.2582 | Yes | ||
| 4 | SYTL2 | 3419 | 1.656 | 0.2852 | Yes | ||
| 5 | SYTL4 | 3436 | 1.647 | 0.3673 | Yes | ||
| 6 | EEA1 | 3800 | 1.536 | 0.4253 | Yes | ||
| 7 | SYTL1 | 4277 | 1.415 | 0.4710 | Yes | ||
| 8 | SCUBE1 | 4833 | 1.279 | 0.5056 | Yes | ||
| 9 | RGS19 | 5088 | 1.214 | 0.5532 | Yes | ||
| 10 | TGM3 | 5508 | 1.113 | 0.5868 | Yes | ||
| 11 | GNA14 | 9191 | 0.324 | 0.4052 | No | ||
| 12 | TDGF1 | 13718 | -0.867 | 0.2056 | No | ||
| 13 | GNAI1 | 14524 | -1.143 | 0.2200 | No |
