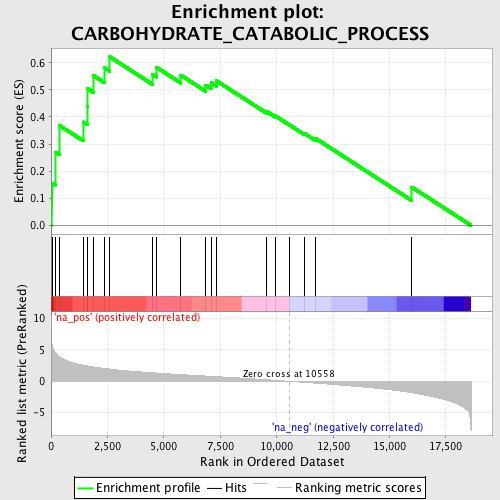
Profile of the Running ES Score & Positions of GeneSet Members on the Rank Ordered List
| Dataset | set03_truncNotch_versus_absentNotch |
| Phenotype | NoPhenotypeAvailable |
| Upregulated in class | na_pos |
| GeneSet | CARBOHYDRATE_CATABOLIC_PROCESS |
| Enrichment Score (ES) | 0.6218189 |
| Normalized Enrichment Score (NES) | 1.9303939 |
| Nominal p-value | 0.0019305019 |
| FDR q-value | 0.08323339 |
| FWER p-Value | 0.308 |
| PROBE | GENE SYMBOL | GENE_TITLE | RANK IN GENE LIST | RANK METRIC SCORE | RUNNING ES | CORE ENRICHMENT | |
|---|---|---|---|---|---|---|---|
| 1 | ALDOA | 39 | 5.848 | 0.1564 | Yes | ||
| 2 | GNPDA1 | 200 | 4.535 | 0.2707 | Yes | ||
| 3 | PYGB | 355 | 3.949 | 0.3695 | Yes | ||
| 4 | PGD | 1428 | 2.571 | 0.3815 | Yes | ||
| 5 | PFKM | 1598 | 2.460 | 0.4391 | Yes | ||
| 6 | PFKFB1 | 1609 | 2.453 | 0.5050 | Yes | ||
| 7 | GAPDHS | 1867 | 2.293 | 0.5533 | Yes | ||
| 8 | PFKL | 2361 | 2.045 | 0.5823 | Yes | ||
| 9 | GAA | 2605 | 1.942 | 0.6218 | Yes | ||
| 10 | PGLS | 4485 | 1.359 | 0.5576 | No | ||
| 11 | HK1 | 4677 | 1.314 | 0.5830 | No | ||
| 12 | TREH | 5754 | 1.064 | 0.5539 | No | ||
| 13 | SPACA3 | 6855 | 0.838 | 0.5175 | No | ||
| 14 | MIOX | 7093 | 0.791 | 0.5262 | No | ||
| 15 | GBA2 | 7330 | 0.742 | 0.5336 | No | ||
| 16 | HYAL4 | 9566 | 0.247 | 0.4201 | No | ||
| 17 | ALDOB | 9949 | 0.153 | 0.4037 | No | ||
| 18 | GNS | 10548 | 0.003 | 0.3716 | No | ||
| 19 | CHIT1 | 11223 | -0.166 | 0.3399 | No | ||
| 20 | MGAM | 11734 | -0.295 | 0.3205 | No | ||
| 21 | TKTL1 | 15996 | -1.828 | 0.1409 | No |
