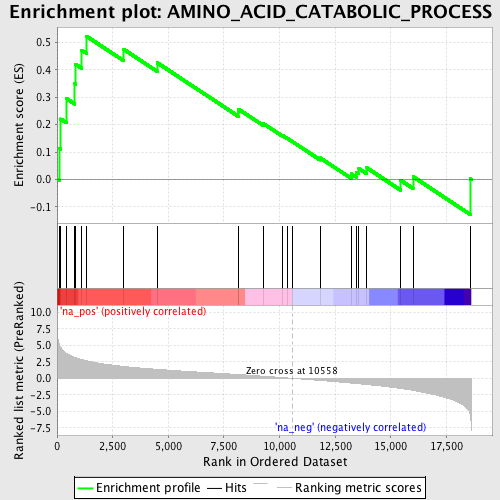
Profile of the Running ES Score & Positions of GeneSet Members on the Rank Ordered List
| Dataset | set03_truncNotch_versus_absentNotch |
| Phenotype | NoPhenotypeAvailable |
| Upregulated in class | na_pos |
| GeneSet | AMINO_ACID_CATABOLIC_PROCESS |
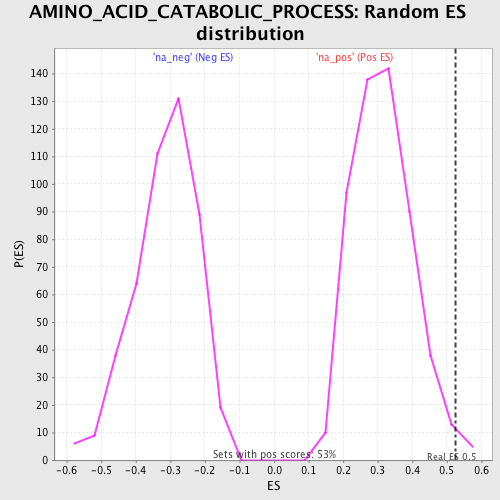
| Enrichment Score (ES) | 0.52382404 |
| Normalized Enrichment Score (NES) | 1.6654855 |
| Nominal p-value | 0.015009381 |
| FDR q-value | 0.35446358 |
| FWER p-Value | 1.0 |
| PROBE | GENE SYMBOL | GENE_TITLE | RANK IN GENE LIST | RANK METRIC SCORE | RUNNING ES | CORE ENRICHMENT | |
|---|---|---|---|---|---|---|---|
| 1 | GOT1 | 97 | 5.074 | 0.1141 | Yes | ||
| 2 | ASL | 160 | 4.682 | 0.2209 | Yes | ||
| 3 | GOT2 | 419 | 3.766 | 0.2956 | Yes | ||
| 4 | BCKDK | 796 | 3.150 | 0.3495 | Yes | ||
| 5 | AMT | 834 | 3.105 | 0.4205 | Yes | ||
| 6 | ALDH4A1 | 1100 | 2.830 | 0.4728 | Yes | ||
| 7 | BCKDHA | 1316 | 2.661 | 0.5238 | Yes | ||
| 8 | GSTZ1 | 2995 | 1.782 | 0.4755 | No | ||
| 9 | DDAH1 | 4494 | 1.358 | 0.4269 | No | ||
| 10 | ASPA | 8143 | 0.570 | 0.2441 | No | ||
| 11 | MCCC2 | 8151 | 0.569 | 0.2571 | No | ||
| 12 | INDO | 9281 | 0.306 | 0.2035 | No | ||
| 13 | BCKDHB | 10118 | 0.114 | 0.1613 | No | ||
| 14 | HPD | 10347 | 0.052 | 0.1502 | No | ||
| 15 | DDAH2 | 10585 | -0.006 | 0.1376 | No | ||
| 16 | HGD | 11827 | -0.324 | 0.0785 | No | ||
| 17 | ARG1 | 13216 | -0.712 | 0.0206 | No | ||
| 18 | ASRGL1 | 13441 | -0.780 | 0.0269 | No | ||
| 19 | GAD2 | 13564 | -0.818 | 0.0396 | No | ||
| 20 | FAH | 13922 | -0.935 | 0.0424 | No | ||
| 21 | GAD1 | 15447 | -1.537 | -0.0034 | No | ||
| 22 | GLDC | 15999 | -1.833 | 0.0100 | No | ||
| 23 | GLUD1 | 18570 | -5.556 | 0.0025 | No |