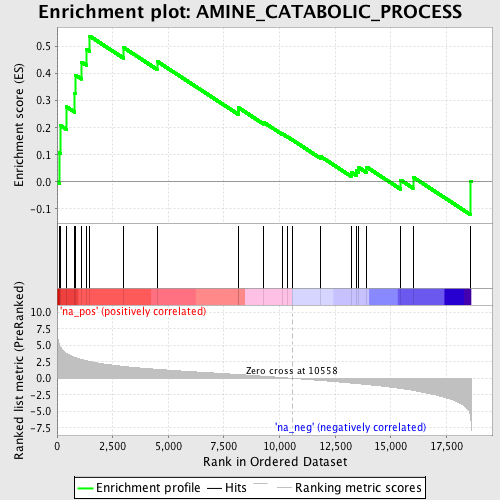
Profile of the Running ES Score & Positions of GeneSet Members on the Rank Ordered List
| Dataset | set03_truncNotch_versus_absentNotch |
| Phenotype | NoPhenotypeAvailable |
| Upregulated in class | na_pos |
| GeneSet | AMINE_CATABOLIC_PROCESS |
| Enrichment Score (ES) | 0.53872347 |
| Normalized Enrichment Score (NES) | 1.7367799 |
| Nominal p-value | 0.0057361377 |
| FDR q-value | 0.22922677 |
| FWER p-Value | 0.959 |
| PROBE | GENE SYMBOL | GENE_TITLE | RANK IN GENE LIST | RANK METRIC SCORE | RUNNING ES | CORE ENRICHMENT | |
|---|---|---|---|---|---|---|---|
| 1 | GOT1 | 97 | 5.074 | 0.1074 | Yes | ||
| 2 | ASL | 160 | 4.682 | 0.2079 | Yes | ||
| 3 | GOT2 | 419 | 3.766 | 0.2776 | Yes | ||
| 4 | BCKDK | 796 | 3.150 | 0.3273 | Yes | ||
| 5 | AMT | 834 | 3.105 | 0.3942 | Yes | ||
| 6 | ALDH4A1 | 1100 | 2.830 | 0.4428 | Yes | ||
| 7 | BCKDHA | 1316 | 2.661 | 0.4903 | Yes | ||
| 8 | DHPS | 1466 | 2.546 | 0.5387 | Yes | ||
| 9 | GSTZ1 | 2995 | 1.782 | 0.4961 | No | ||
| 10 | DDAH1 | 4494 | 1.358 | 0.4456 | No | ||
| 11 | ASPA | 8143 | 0.570 | 0.2621 | No | ||
| 12 | MCCC2 | 8151 | 0.569 | 0.2743 | No | ||
| 13 | INDO | 9281 | 0.306 | 0.2204 | No | ||
| 14 | BCKDHB | 10118 | 0.114 | 0.1780 | No | ||
| 15 | HPD | 10347 | 0.052 | 0.1669 | No | ||
| 16 | DDAH2 | 10585 | -0.006 | 0.1543 | No | ||
| 17 | HGD | 11827 | -0.324 | 0.0947 | No | ||
| 18 | ARG1 | 13216 | -0.712 | 0.0359 | No | ||
| 19 | ASRGL1 | 13441 | -0.780 | 0.0411 | No | ||
| 20 | GAD2 | 13564 | -0.818 | 0.0527 | No | ||
| 21 | FAH | 13922 | -0.935 | 0.0542 | No | ||
| 22 | GAD1 | 15447 | -1.537 | 0.0064 | No | ||
| 23 | GLDC | 15999 | -1.833 | 0.0174 | No | ||
| 24 | GLUD1 | 18570 | -5.556 | 0.0025 | No |
