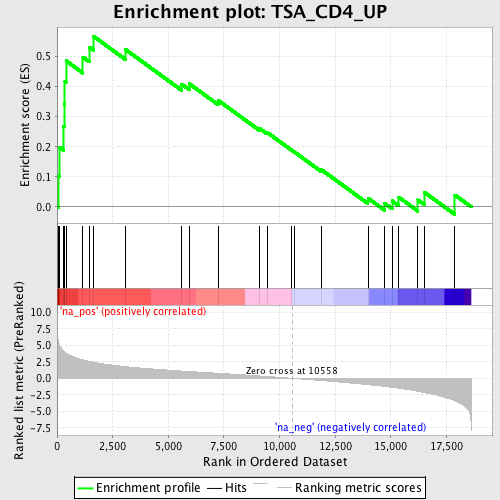
Profile of the Running ES Score & Positions of GeneSet Members on the Rank Ordered List
| Dataset | set03_truncNotch_versus_absentNotch |
| Phenotype | NoPhenotypeAvailable |
| Upregulated in class | na_pos |
| GeneSet | TSA_CD4_UP |
| Enrichment Score (ES) | 0.56761616 |
| Normalized Enrichment Score (NES) | 1.8389844 |
| Nominal p-value | 0.0019120459 |
| FDR q-value | 0.08029662 |
| FWER p-Value | 0.746 |
| PROBE | GENE SYMBOL | GENE_TITLE | RANK IN GENE LIST | RANK METRIC SCORE | RUNNING ES | CORE ENRICHMENT | |
|---|---|---|---|---|---|---|---|
| 1 | CD6 | 55 | 5.587 | 0.1031 | Yes | ||
| 2 | CD82 | 91 | 5.141 | 0.1988 | Yes | ||
| 3 | STRA13 | 283 | 4.174 | 0.2678 | Yes | ||
| 4 | BAK1 | 322 | 4.051 | 0.3427 | Yes | ||
| 5 | CD2 | 352 | 3.962 | 0.4163 | Yes | ||
| 6 | USF2 | 402 | 3.794 | 0.4857 | Yes | ||
| 7 | MIF | 1162 | 2.776 | 0.4976 | Yes | ||
| 8 | COX8A | 1449 | 2.559 | 0.5308 | Yes | ||
| 9 | TP53 | 1627 | 2.442 | 0.5676 | Yes | ||
| 10 | ITGB4BP | 3084 | 1.753 | 0.5226 | No | ||
| 11 | PSMB4 | 5601 | 1.095 | 0.4080 | No | ||
| 12 | PA2G4 | 5937 | 1.028 | 0.4095 | No | ||
| 13 | TGFB1 | 7233 | 0.765 | 0.3544 | No | ||
| 14 | IGFBP4 | 9091 | 0.349 | 0.2611 | No | ||
| 15 | BYSL | 9441 | 0.274 | 0.2476 | No | ||
| 16 | RARA | 10541 | 0.004 | 0.1885 | No | ||
| 17 | ENO2 | 10667 | -0.027 | 0.1823 | No | ||
| 18 | SSR4 | 11886 | -0.339 | 0.1233 | No | ||
| 19 | MYC | 13974 | -0.949 | 0.0290 | No | ||
| 20 | TMSB4X | 14725 | -1.219 | 0.0118 | No | ||
| 21 | FKBP4 | 15057 | -1.363 | 0.0199 | No | ||
| 22 | HMGN1 | 15359 | -1.500 | 0.0322 | No | ||
| 23 | HSP90AB1 | 16219 | -1.954 | 0.0231 | No | ||
| 24 | YWHAH | 16519 | -2.160 | 0.0480 | No | ||
| 25 | EIF4A1 | 17880 | -3.409 | 0.0396 | No |
