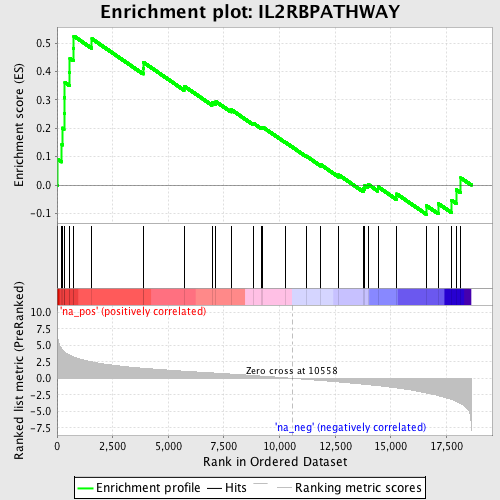
Profile of the Running ES Score & Positions of GeneSet Members on the Rank Ordered List
| Dataset | set03_truncNotch_versus_absentNotch |
| Phenotype | NoPhenotypeAvailable |
| Upregulated in class | na_pos |
| GeneSet | IL2RBPATHWAY |
| Enrichment Score (ES) | 0.52424884 |
| Normalized Enrichment Score (NES) | 1.8431405 |
| Nominal p-value | 0.001980198 |
| FDR q-value | 0.08308808 |
| FWER p-Value | 0.729 |
| PROBE | GENE SYMBOL | GENE_TITLE | RANK IN GENE LIST | RANK METRIC SCORE | RUNNING ES | CORE ENRICHMENT | |
|---|---|---|---|---|---|---|---|
| 1 | IL2RA | 17 | 6.733 | 0.0917 | Yes | ||
| 2 | IL2RB | 214 | 4.418 | 0.1419 | Yes | ||
| 3 | JAK3 | 234 | 4.364 | 0.2009 | Yes | ||
| 4 | BAD | 311 | 4.076 | 0.2529 | Yes | ||
| 5 | HRAS | 327 | 4.040 | 0.3076 | Yes | ||
| 6 | SOCS3 | 351 | 3.965 | 0.3609 | Yes | ||
| 7 | MAPK3 | 561 | 3.505 | 0.3978 | Yes | ||
| 8 | BCL2 | 576 | 3.485 | 0.4450 | Yes | ||
| 9 | PTPN6 | 726 | 3.242 | 0.4816 | Yes | ||
| 10 | STAT5A | 754 | 3.208 | 0.5242 | Yes | ||
| 11 | RPS6KB1 | 1566 | 2.477 | 0.5147 | No | ||
| 12 | STAT5B | 3867 | 1.521 | 0.4118 | No | ||
| 13 | SHC1 | 3886 | 1.514 | 0.4317 | No | ||
| 14 | NMI | 5706 | 1.074 | 0.3486 | No | ||
| 15 | SOS1 | 6963 | 0.819 | 0.2922 | No | ||
| 16 | PPIA | 7138 | 0.784 | 0.2936 | No | ||
| 17 | PIK3R1 | 7817 | 0.642 | 0.2660 | No | ||
| 18 | IRS1 | 8813 | 0.418 | 0.2182 | No | ||
| 19 | FOS | 9169 | 0.329 | 0.2036 | No | ||
| 20 | SOCS1 | 9241 | 0.314 | 0.2041 | No | ||
| 21 | JAK1 | 10258 | 0.076 | 0.1505 | No | ||
| 22 | AKT1 | 11195 | -0.161 | 0.1023 | No | ||
| 23 | SYK | 11855 | -0.333 | 0.0714 | No | ||
| 24 | BCL2L1 | 12660 | -0.550 | 0.0357 | No | ||
| 25 | PIK3CA | 13770 | -0.885 | -0.0118 | No | ||
| 26 | CFLAR | 13833 | -0.903 | -0.0027 | No | ||
| 27 | MYC | 13974 | -0.949 | 0.0028 | No | ||
| 28 | IL2RG | 14423 | -1.110 | -0.0061 | No | ||
| 29 | E2F1 | 15267 | -1.457 | -0.0314 | No | ||
| 30 | GRB2 | 16609 | -2.219 | -0.0730 | No | ||
| 31 | CBL | 17138 | -2.619 | -0.0654 | No | ||
| 32 | MAPK1 | 17720 | -3.193 | -0.0528 | No | ||
| 33 | CRKL | 17939 | -3.501 | -0.0164 | No | ||
| 34 | RAF1 | 18148 | -3.836 | 0.0252 | No |
