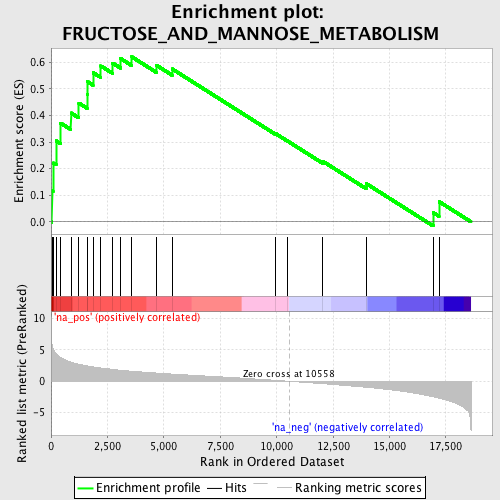
Profile of the Running ES Score & Positions of GeneSet Members on the Rank Ordered List
| Dataset | set03_truncNotch_versus_absentNotch |
| Phenotype | NoPhenotypeAvailable |
| Upregulated in class | na_pos |
| GeneSet | FRUCTOSE_AND_MANNOSE_METABOLISM |
| Enrichment Score (ES) | 0.62099004 |
| Normalized Enrichment Score (NES) | 1.8947093 |
| Nominal p-value | 0.0018050541 |
| FDR q-value | 0.06256458 |
| FWER p-Value | 0.504 |
| PROBE | GENE SYMBOL | GENE_TITLE | RANK IN GENE LIST | RANK METRIC SCORE | RUNNING ES | CORE ENRICHMENT | |
|---|---|---|---|---|---|---|---|
| 1 | ALDOA | 39 | 5.848 | 0.1181 | Yes | ||
| 2 | FBP1 | 88 | 5.157 | 0.2216 | Yes | ||
| 3 | GMPPA | 223 | 4.397 | 0.3047 | Yes | ||
| 4 | KHK | 417 | 3.770 | 0.3719 | Yes | ||
| 5 | PMM1 | 881 | 3.057 | 0.4098 | Yes | ||
| 6 | TPI1 | 1231 | 2.726 | 0.4471 | Yes | ||
| 7 | PFKM | 1598 | 2.460 | 0.4780 | Yes | ||
| 8 | PFKFB1 | 1609 | 2.453 | 0.5279 | Yes | ||
| 9 | PMM2 | 1860 | 2.296 | 0.5616 | Yes | ||
| 10 | GMPPB | 2206 | 2.121 | 0.5867 | Yes | ||
| 11 | HK3 | 2725 | 1.892 | 0.5977 | Yes | ||
| 12 | PFKP | 3081 | 1.754 | 0.6147 | Yes | ||
| 13 | FBP2 | 3578 | 1.604 | 0.6210 | Yes | ||
| 14 | HK1 | 4677 | 1.314 | 0.5890 | No | ||
| 15 | GCK | 5366 | 1.148 | 0.5756 | No | ||
| 16 | ALDOB | 9949 | 0.153 | 0.3323 | No | ||
| 17 | GMDS | 10469 | 0.019 | 0.3048 | No | ||
| 18 | ALDOC | 12047 | -0.381 | 0.2279 | No | ||
| 19 | PFKFB3 | 13980 | -0.951 | 0.1435 | No | ||
| 20 | FPGT | 16939 | -2.453 | 0.0349 | No | ||
| 21 | HK2 | 17200 | -2.687 | 0.0761 | No |
