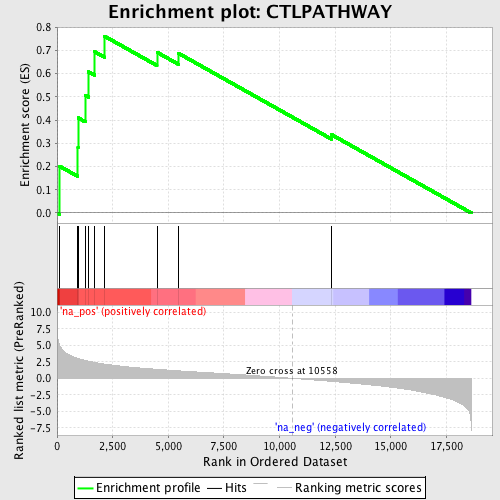
Profile of the Running ES Score & Positions of GeneSet Members on the Rank Ordered List
| Dataset | set03_truncNotch_versus_absentNotch |
| Phenotype | NoPhenotypeAvailable |
| Upregulated in class | na_pos |
| GeneSet | CTLPATHWAY |
| Enrichment Score (ES) | 0.76191527 |
| Normalized Enrichment Score (NES) | 1.9279664 |
| Nominal p-value | 0.0 |
| FDR q-value | 0.046307307 |
| FWER p-Value | 0.365 |
| PROBE | GENE SYMBOL | GENE_TITLE | RANK IN GENE LIST | RANK METRIC SCORE | RUNNING ES | CORE ENRICHMENT | |
|---|---|---|---|---|---|---|---|
| 1 | B2M | 120 | 4.920 | 0.2012 | Yes | ||
| 2 | PRF1 | 936 | 3.000 | 0.2840 | Yes | ||
| 3 | ITGAL | 945 | 2.992 | 0.4098 | Yes | ||
| 4 | CD3D | 1265 | 2.704 | 0.5068 | Yes | ||
| 5 | ICAM1 | 1415 | 2.587 | 0.6079 | Yes | ||
| 6 | ITGB2 | 1690 | 2.399 | 0.6945 | Yes | ||
| 7 | CD3G | 2127 | 2.154 | 0.7619 | Yes | ||
| 8 | CD3E | 4490 | 1.358 | 0.6923 | No | ||
| 9 | TRB@ | 5457 | 1.123 | 0.6878 | No | ||
| 10 | GZMB | 12340 | -0.459 | 0.3373 | No |
