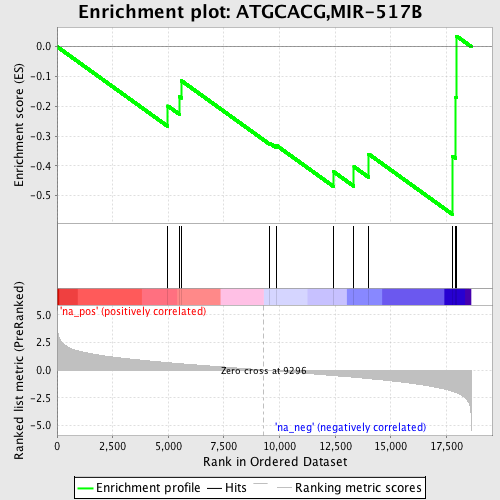
Profile of the Running ES Score & Positions of GeneSet Members on the Rank Ordered List
| Dataset | set03_absentNotch_versus_wtNotch |
| Phenotype | NoPhenotypeAvailable |
| Upregulated in class | na_neg |
| GeneSet | ATGCACG,MIR-517B |
| Enrichment Score (ES) | -0.562953 |
| Normalized Enrichment Score (NES) | -1.4745189 |
| Nominal p-value | 0.053604435 |
| FDR q-value | 0.4228105 |
| FWER p-Value | 0.999 |
| PROBE | GENE SYMBOL | GENE_TITLE | RANK IN GENE LIST | RANK METRIC SCORE | RUNNING ES | CORE ENRICHMENT | |
|---|---|---|---|---|---|---|---|
| 1 | SFRS1 | 4978 | 0.672 | -0.1990 | No | ||
| 2 | PRDM8 | 5499 | 0.581 | -0.1677 | No | ||
| 3 | MORF4L1 | 5589 | 0.569 | -0.1144 | No | ||
| 4 | CAMK2G | 9552 | -0.040 | -0.3233 | No | ||
| 5 | MORF4L2 | 9843 | -0.083 | -0.3304 | No | ||
| 6 | NR4A3 | 12418 | -0.489 | -0.4189 | Yes | ||
| 7 | LASS1 | 13342 | -0.645 | -0.4027 | Yes | ||
| 8 | FUSIP1 | 14003 | -0.765 | -0.3601 | Yes | ||
| 9 | TBX15 | 17779 | -1.916 | -0.3674 | Yes | ||
| 10 | NRXN1 | 17919 | -2.006 | -0.1701 | Yes | ||
| 11 | CABP7 | 17957 | -2.034 | 0.0354 | Yes |
