Profile of the Running ES Score & Positions of GeneSet Members on the Rank Ordered List
| Dataset | set03_absentNotch_versus_wtNotch |
| Phenotype | NoPhenotypeAvailable |
| Upregulated in class | na_pos |
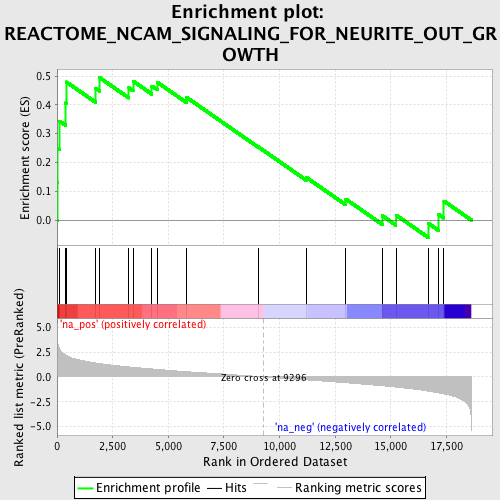
| GeneSet | REACTOME_NCAM_SIGNALING_FOR_NEURITE_OUT_GROWTH |
| Enrichment Score (ES) | 0.49450558 |
| Normalized Enrichment Score (NES) | 1.5881242 |
| Nominal p-value | 0.02536998 |
| FDR q-value | 0.56319493 |
| FWER p-Value | 1.0 |
| PROBE | GENE SYMBOL | GENE_TITLE | RANK IN GENE LIST | RANK METRIC SCORE | RUNNING ES | CORE ENRICHMENT | |
|---|---|---|---|---|---|---|---|
| 1 | PTK2 | 12 | 3.772 | 0.1303 | Yes | ||
| 2 | CREB1 | 29 | 3.440 | 0.2489 | Yes | ||
| 3 | RAF1 | 108 | 2.852 | 0.3437 | Yes | ||
| 4 | NCAM1 | 374 | 2.217 | 0.4064 | Yes | ||
| 5 | FYN | 416 | 2.163 | 0.4793 | Yes | ||
| 6 | PRNP | 1724 | 1.401 | 0.4576 | Yes | ||
| 7 | CNTN2 | 1908 | 1.346 | 0.4945 | Yes | ||
| 8 | MAP2K2 | 3227 | 1.012 | 0.4588 | No | ||
| 9 | YWHAB | 3415 | 0.970 | 0.4824 | No | ||
| 10 | PTPRA | 4259 | 0.804 | 0.4650 | No | ||
| 11 | KRAS | 4500 | 0.757 | 0.4783 | No | ||
| 12 | MAPK1 | 5807 | 0.532 | 0.4266 | No | ||
| 13 | MAP2K1 | 9029 | 0.041 | 0.2548 | No | ||
| 14 | PSPN | 11191 | -0.288 | 0.1486 | No | ||
| 15 | GFRA1 | 12978 | -0.582 | 0.0728 | No | ||
| 16 | AGRN | 14617 | -0.880 | 0.0152 | No | ||
| 17 | MAPK3 | 15232 | -1.017 | 0.0175 | No | ||
| 18 | NCAN | 16680 | -1.421 | -0.0110 | No | ||
| 19 | RPS6KA5 | 17160 | -1.611 | 0.0192 | No | ||
| 20 | SOS1 | 17388 | -1.701 | 0.0660 | No |
