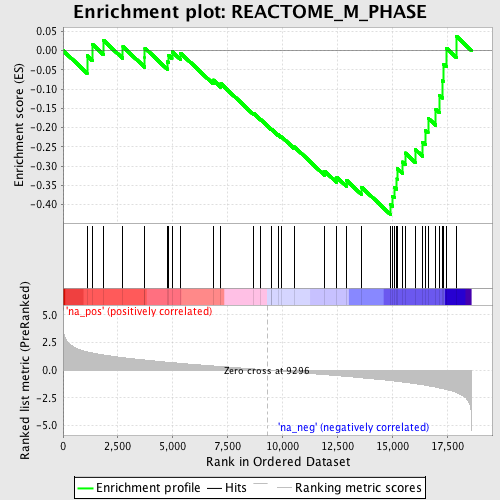
Profile of the Running ES Score & Positions of GeneSet Members on the Rank Ordered List
| Dataset | set03_absentNotch_versus_wtNotch |
| Phenotype | NoPhenotypeAvailable |
| Upregulated in class | na_neg |
| GeneSet | REACTOME_M_PHASE |
| Enrichment Score (ES) | -0.42570648 |
| Normalized Enrichment Score (NES) | -1.5867248 |
| Nominal p-value | 0.00952381 |
| FDR q-value | 0.4426925 |
| FWER p-Value | 1.0 |
| PROBE | GENE SYMBOL | GENE_TITLE | RANK IN GENE LIST | RANK METRIC SCORE | RUNNING ES | CORE ENRICHMENT | |
|---|---|---|---|---|---|---|---|
| 1 | NUP107 | 1093 | 1.651 | -0.0134 | No | ||
| 2 | CLASP1 | 1345 | 1.547 | 0.0157 | No | ||
| 3 | PAFAH1B1 | 1832 | 1.367 | 0.0272 | No | ||
| 4 | ZW10 | 2726 | 1.125 | 0.0101 | No | ||
| 5 | CENPE | 3724 | 0.911 | -0.0185 | No | ||
| 6 | NUP43 | 3729 | 0.910 | 0.0064 | No | ||
| 7 | ZWINT | 4757 | 0.712 | -0.0293 | No | ||
| 8 | MLF1IP | 4799 | 0.705 | -0.0121 | No | ||
| 9 | MAPRE1 | 4963 | 0.675 | -0.0023 | No | ||
| 10 | PPP1CC | 5349 | 0.607 | -0.0063 | No | ||
| 11 | KIF20A | 6844 | 0.377 | -0.0763 | No | ||
| 12 | SEC13 | 7193 | 0.327 | -0.0861 | No | ||
| 13 | XPO1 | 8674 | 0.106 | -0.1628 | No | ||
| 14 | CLASP2 | 9002 | 0.046 | -0.1792 | No | ||
| 15 | KNTC1 | 9479 | -0.029 | -0.2040 | No | ||
| 16 | NUP160 | 9501 | -0.031 | -0.2043 | No | ||
| 17 | RAD21 | 9795 | -0.074 | -0.2180 | No | ||
| 18 | MAD2L1 | 9962 | -0.100 | -0.2242 | No | ||
| 19 | KIF2B | 10545 | -0.193 | -0.2502 | No | ||
| 20 | KIF23 | 11922 | -0.408 | -0.3130 | No | ||
| 21 | PMF1 | 12476 | -0.499 | -0.3291 | No | ||
| 22 | BUB1B | 12918 | -0.573 | -0.3370 | No | ||
| 23 | SGOL2 | 13599 | -0.692 | -0.3545 | No | ||
| 24 | RANGAP1 | 14922 | -0.947 | -0.3996 | Yes | ||
| 25 | STAG2 | 15018 | -0.967 | -0.3781 | Yes | ||
| 26 | CDCA8 | 15107 | -0.989 | -0.3556 | Yes | ||
| 27 | RANBP2 | 15216 | -1.014 | -0.3335 | Yes | ||
| 28 | SMC1A | 15227 | -1.016 | -0.3061 | Yes | ||
| 29 | CENPA | 15464 | -1.069 | -0.2893 | Yes | ||
| 30 | CDC20 | 15595 | -1.104 | -0.2659 | Yes | ||
| 31 | PLK1 | 16048 | -1.222 | -0.2566 | Yes | ||
| 32 | KIF2A | 16383 | -1.319 | -0.2382 | Yes | ||
| 33 | BIRC5 | 16509 | -1.363 | -0.2074 | Yes | ||
| 34 | CLIP1 | 16633 | -1.403 | -0.1754 | Yes | ||
| 35 | BUB3 | 16988 | -1.538 | -0.1521 | Yes | ||
| 36 | SGOL1 | 17155 | -1.609 | -0.1167 | Yes | ||
| 37 | NDC80 | 17280 | -1.656 | -0.0778 | Yes | ||
| 38 | CENPC1 | 17349 | -1.685 | -0.0351 | Yes | ||
| 39 | BUB1 | 17477 | -1.742 | 0.0061 | Yes | ||
| 40 | NUP37 | 17918 | -2.004 | 0.0376 | Yes |
