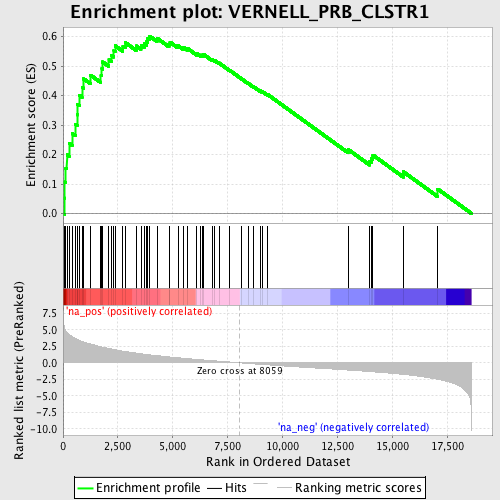
Profile of the Running ES Score & Positions of GeneSet Members on the Rank Ordered List
| Dataset | set03_absentNotch_versus_truncNotch |
| Phenotype | NoPhenotypeAvailable |
| Upregulated in class | na_pos |
| GeneSet | VERNELL_PRB_CLSTR1 |
| Enrichment Score (ES) | 0.60130864 |
| Normalized Enrichment Score (NES) | 2.3593736 |
| Nominal p-value | 0.0 |
| FDR q-value | 0.0 |
| FWER p-Value | 0.0 |
| PROBE | GENE SYMBOL | GENE_TITLE | RANK IN GENE LIST | RANK METRIC SCORE | RUNNING ES | CORE ENRICHMENT | |
|---|---|---|---|---|---|---|---|
| 1 | RAD51AP1 | 59 | 5.387 | 0.0527 | Yes | ||
| 2 | RRM2 | 68 | 5.276 | 0.1070 | Yes | ||
| 3 | TMPO | 124 | 4.809 | 0.1539 | Yes | ||
| 4 | DCK | 177 | 4.612 | 0.1990 | Yes | ||
| 5 | EED | 277 | 4.265 | 0.2379 | Yes | ||
| 6 | SKP2 | 413 | 3.939 | 0.2715 | Yes | ||
| 7 | ATAD2 | 561 | 3.679 | 0.3017 | Yes | ||
| 8 | FANCL | 641 | 3.557 | 0.3344 | Yes | ||
| 9 | MCM4 | 650 | 3.547 | 0.3707 | Yes | ||
| 10 | PCNA | 752 | 3.379 | 0.4003 | Yes | ||
| 11 | POLD3 | 865 | 3.229 | 0.4278 | Yes | ||
| 12 | DEK | 939 | 3.138 | 0.4564 | Yes | ||
| 13 | BLM | 1250 | 2.831 | 0.4691 | Yes | ||
| 14 | E2F2 | 1725 | 2.416 | 0.4686 | Yes | ||
| 15 | RRM1 | 1769 | 2.385 | 0.4910 | Yes | ||
| 16 | CENPK | 1801 | 2.361 | 0.5139 | Yes | ||
| 17 | TFDP1 | 2090 | 2.165 | 0.5208 | Yes | ||
| 18 | CDC25A | 2214 | 2.075 | 0.5357 | Yes | ||
| 19 | RFC3 | 2315 | 2.003 | 0.5511 | Yes | ||
| 20 | SNTB2 | 2371 | 1.966 | 0.5685 | Yes | ||
| 21 | CDCA4 | 2726 | 1.760 | 0.5677 | Yes | ||
| 22 | EZH2 | 2839 | 1.693 | 0.5792 | Yes | ||
| 23 | HMGB2 | 3330 | 1.469 | 0.5681 | Yes | ||
| 24 | FST | 3550 | 1.366 | 0.5704 | Yes | ||
| 25 | MELK | 3695 | 1.301 | 0.5762 | Yes | ||
| 26 | CCNE1 | 3814 | 1.250 | 0.5828 | Yes | ||
| 27 | RFC4 | 3860 | 1.230 | 0.5931 | Yes | ||
| 28 | DONSON | 3941 | 1.204 | 0.6013 | Yes | ||
| 29 | CNOT6L | 4282 | 1.075 | 0.5941 | No | ||
| 30 | BARD1 | 4829 | 0.888 | 0.5739 | No | ||
| 31 | RECQL4 | 4869 | 0.878 | 0.5809 | No | ||
| 32 | HUNK | 5239 | 0.765 | 0.5690 | No | ||
| 33 | MCM7 | 5501 | 0.680 | 0.5620 | No | ||
| 34 | PTX3 | 5662 | 0.629 | 0.5599 | No | ||
| 35 | CDKN1A | 6096 | 0.508 | 0.5418 | No | ||
| 36 | FANCA | 6269 | 0.462 | 0.5374 | No | ||
| 37 | CHAF1A | 6354 | 0.438 | 0.5374 | No | ||
| 38 | ESCO2 | 6407 | 0.424 | 0.5390 | No | ||
| 39 | SLBP | 6790 | 0.324 | 0.5218 | No | ||
| 40 | BTG3 | 6918 | 0.286 | 0.5179 | No | ||
| 41 | JPH1 | 7106 | 0.236 | 0.5103 | No | ||
| 42 | CCDC5 | 7590 | 0.118 | 0.4855 | No | ||
| 43 | RAB27A | 8118 | -0.012 | 0.4572 | No | ||
| 44 | FBXO5 | 8445 | -0.100 | 0.4407 | No | ||
| 45 | NPAT | 8695 | -0.159 | 0.4289 | No | ||
| 46 | EPS8 | 8977 | -0.225 | 0.4161 | No | ||
| 47 | CDCA5 | 9088 | -0.256 | 0.4129 | No | ||
| 48 | KCNK1 | 9304 | -0.300 | 0.4044 | No | ||
| 49 | VRK1 | 12993 | -1.092 | 0.2170 | No | ||
| 50 | PBX3 | 13972 | -1.320 | 0.1780 | No | ||
| 51 | ANKRD25 | 14048 | -1.339 | 0.1879 | No | ||
| 52 | MCM8 | 14118 | -1.357 | 0.1983 | No | ||
| 53 | ASF1B | 15505 | -1.747 | 0.1417 | No | ||
| 54 | EGR1 | 17072 | -2.490 | 0.0832 | No |
