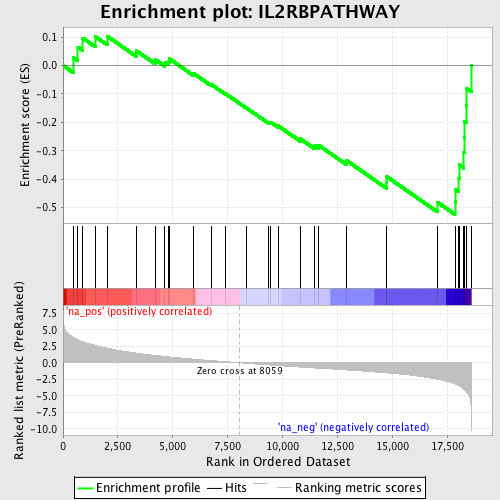
Profile of the Running ES Score & Positions of GeneSet Members on the Rank Ordered List
| Dataset | set03_absentNotch_versus_truncNotch |
| Phenotype | NoPhenotypeAvailable |
| Upregulated in class | na_neg |
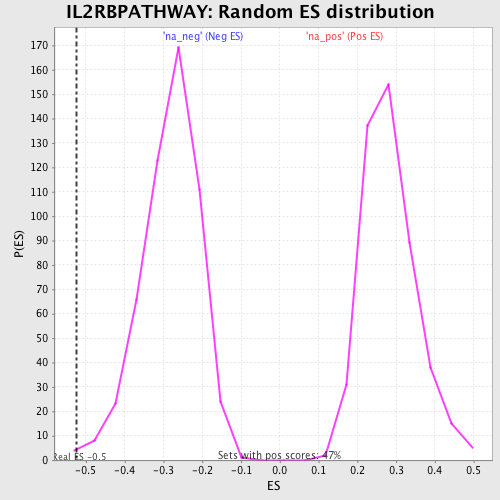
| GeneSet | IL2RBPATHWAY |
| Enrichment Score (ES) | -0.52424896 |
| Normalized Enrichment Score (NES) | -1.8574109 |
| Nominal p-value | 0.007561437 |
| FDR q-value | 0.07643949 |
| FWER p-Value | 0.657 |
| PROBE | GENE SYMBOL | GENE_TITLE | RANK IN GENE LIST | RANK METRIC SCORE | RUNNING ES | CORE ENRICHMENT | |
|---|---|---|---|---|---|---|---|
| 1 | RAF1 | 468 | 3.836 | 0.0276 | No | ||
| 2 | CRKL | 677 | 3.501 | 0.0645 | No | ||
| 3 | MAPK1 | 896 | 3.193 | 0.0967 | No | ||
| 4 | CBL | 1478 | 2.619 | 0.1014 | No | ||
| 5 | GRB2 | 2007 | 2.219 | 0.1035 | No | ||
| 6 | E2F1 | 3349 | 1.457 | 0.0514 | No | ||
| 7 | IL2RG | 4193 | 1.110 | 0.0213 | No | ||
| 8 | MYC | 4642 | 0.949 | 0.0102 | No | ||
| 9 | CFLAR | 4783 | 0.903 | 0.0151 | No | ||
| 10 | PIK3CA | 4846 | 0.885 | 0.0240 | No | ||
| 11 | BCL2L1 | 5956 | 0.550 | -0.0282 | No | ||
| 12 | SYK | 6761 | 0.333 | -0.0668 | No | ||
| 13 | AKT1 | 7421 | 0.161 | -0.1001 | No | ||
| 14 | JAK1 | 8358 | -0.076 | -0.1494 | No | ||
| 15 | SOCS1 | 9375 | -0.314 | -0.1998 | No | ||
| 16 | FOS | 9447 | -0.329 | -0.1991 | No | ||
| 17 | IRS1 | 9803 | -0.418 | -0.2124 | No | ||
| 18 | PIK3R1 | 10799 | -0.642 | -0.2572 | No | ||
| 19 | PPIA | 11478 | -0.784 | -0.2829 | No | ||
| 20 | SOS1 | 11653 | -0.819 | -0.2810 | No | ||
| 21 | NMI | 12910 | -1.074 | -0.3338 | No | ||
| 22 | SHC1 | 14730 | -1.514 | -0.4109 | No | ||
| 23 | STAT5B | 14749 | -1.521 | -0.3909 | No | ||
| 24 | RPS6KB1 | 17050 | -2.477 | -0.4806 | Yes | ||
| 25 | STAT5A | 17862 | -3.208 | -0.4801 | Yes | ||
| 26 | PTPN6 | 17890 | -3.242 | -0.4370 | Yes | ||
| 27 | BCL2 | 18040 | -3.485 | -0.3971 | Yes | ||
| 28 | MAPK3 | 18055 | -3.505 | -0.3496 | Yes | ||
| 29 | SOCS3 | 18265 | -3.965 | -0.3064 | Yes | ||
| 30 | HRAS | 18289 | -4.040 | -0.2520 | Yes | ||
| 31 | BAD | 18305 | -4.076 | -0.1968 | Yes | ||
| 32 | JAK3 | 18382 | -4.364 | -0.1409 | Yes | ||
| 33 | IL2RB | 18402 | -4.418 | -0.0811 | Yes | ||
| 34 | IL2RA | 18599 | -6.733 | 0.0009 | Yes |