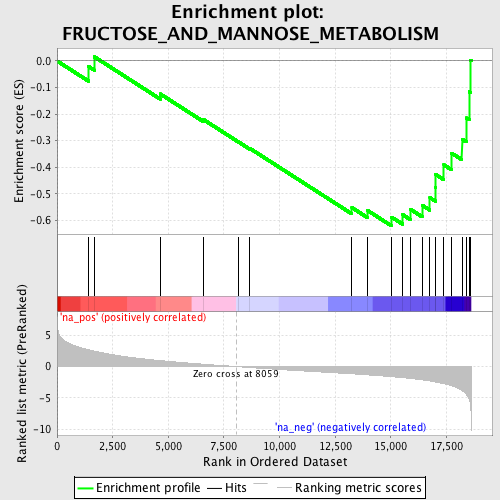
Profile of the Running ES Score & Positions of GeneSet Members on the Rank Ordered List
| Dataset | set03_absentNotch_versus_truncNotch |
| Phenotype | NoPhenotypeAvailable |
| Upregulated in class | na_neg |
| GeneSet | FRUCTOSE_AND_MANNOSE_METABOLISM |
| Enrichment Score (ES) | -0.62099016 |
| Normalized Enrichment Score (NES) | -1.9153808 |
| Nominal p-value | 0.0020449897 |
| FDR q-value | 0.061123233 |
| FWER p-Value | 0.401 |
| PROBE | GENE SYMBOL | GENE_TITLE | RANK IN GENE LIST | RANK METRIC SCORE | RUNNING ES | CORE ENRICHMENT | |
|---|---|---|---|---|---|---|---|
| 1 | HK2 | 1416 | 2.687 | -0.0209 | No | ||
| 2 | FPGT | 1677 | 2.453 | 0.0156 | No | ||
| 3 | PFKFB3 | 4636 | 0.951 | -0.1240 | No | ||
| 4 | ALDOC | 6569 | 0.381 | -0.2200 | No | ||
| 5 | GMDS | 8147 | -0.019 | -0.3044 | No | ||
| 6 | ALDOB | 8667 | -0.153 | -0.3292 | No | ||
| 7 | GCK | 13250 | -1.148 | -0.5520 | No | ||
| 8 | HK1 | 13939 | -1.314 | -0.5619 | No | ||
| 9 | FBP2 | 15038 | -1.604 | -0.5880 | Yes | ||
| 10 | PFKP | 15535 | -1.754 | -0.5786 | Yes | ||
| 11 | HK3 | 15891 | -1.892 | -0.5588 | Yes | ||
| 12 | GMPPB | 16410 | -2.121 | -0.5431 | Yes | ||
| 13 | PMM2 | 16756 | -2.296 | -0.5144 | Yes | ||
| 14 | PFKFB1 | 17007 | -2.453 | -0.4774 | Yes | ||
| 15 | PFKM | 17018 | -2.460 | -0.4274 | Yes | ||
| 16 | TPI1 | 17385 | -2.726 | -0.3910 | Yes | ||
| 17 | PMM1 | 17735 | -3.057 | -0.3470 | Yes | ||
| 18 | KHK | 18199 | -3.770 | -0.2944 | Yes | ||
| 19 | GMPPA | 18393 | -4.397 | -0.2144 | Yes | ||
| 20 | FBP1 | 18528 | -5.157 | -0.1155 | Yes | ||
| 21 | ALDOA | 18577 | -5.848 | 0.0021 | Yes |
