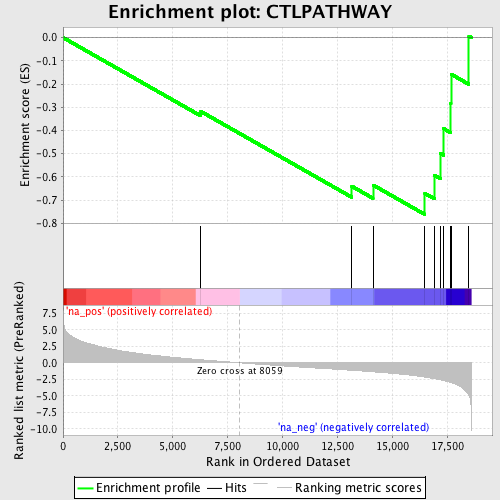
Profile of the Running ES Score & Positions of GeneSet Members on the Rank Ordered List
| Dataset | set03_absentNotch_versus_truncNotch |
| Phenotype | NoPhenotypeAvailable |
| Upregulated in class | na_neg |
| GeneSet | CTLPATHWAY |
| Enrichment Score (ES) | -0.7619152 |
| Normalized Enrichment Score (NES) | -1.8727658 |
| Nominal p-value | 0.0019379845 |
| FDR q-value | 0.07054907 |
| FWER p-Value | 0.592 |
| PROBE | GENE SYMBOL | GENE_TITLE | RANK IN GENE LIST | RANK METRIC SCORE | RUNNING ES | CORE ENRICHMENT | |
|---|---|---|---|---|---|---|---|
| 1 | GZMB | 6276 | 0.459 | -0.3179 | No | ||
| 2 | TRB@ | 13159 | -1.123 | -0.6404 | No | ||
| 3 | CD3E | 14126 | -1.358 | -0.6350 | No | ||
| 4 | CD3G | 16489 | -2.154 | -0.6710 | Yes | ||
| 5 | ITGB2 | 16926 | -2.399 | -0.5932 | Yes | ||
| 6 | ICAM1 | 17201 | -2.587 | -0.4988 | Yes | ||
| 7 | CD3D | 17351 | -2.704 | -0.3926 | Yes | ||
| 8 | ITGAL | 17671 | -2.992 | -0.2835 | Yes | ||
| 9 | PRF1 | 17680 | -3.000 | -0.1574 | Yes | ||
| 10 | B2M | 18496 | -4.920 | 0.0064 | Yes |
