Profile of the Running ES Score & Positions of GeneSet Members on the Rank Ordered List
| Dataset | set03_absentNotch_versus_normalThy |
| Phenotype | NoPhenotypeAvailable |
| Upregulated in class | na_pos |
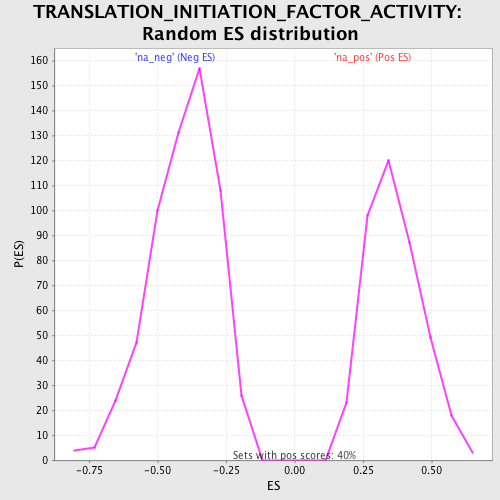
| GeneSet | TRANSLATION_INITIATION_FACTOR_ACTIVITY |
| Enrichment Score (ES) | 0.80894196 |
| Normalized Enrichment Score (NES) | 2.2190504 |
| Nominal p-value | 0.0 |
| FDR q-value | 1.19911994E-4 |
| FWER p-Value | 0.0010 |
| PROBE | GENE SYMBOL | GENE_TITLE | RANK IN GENE LIST | RANK METRIC SCORE | RUNNING ES | CORE ENRICHMENT | |
|---|---|---|---|---|---|---|---|
| 1 | EIF5A | 26 | 8.461 | 0.1573 | Yes | ||
| 2 | EIF2B5 | 38 | 7.912 | 0.3052 | Yes | ||
| 3 | EIF2B3 | 151 | 5.612 | 0.4044 | Yes | ||
| 4 | COPS5 | 220 | 4.976 | 0.4941 | Yes | ||
| 5 | EIF4B | 291 | 4.621 | 0.5770 | Yes | ||
| 6 | EIF2S2 | 623 | 3.545 | 0.6258 | Yes | ||
| 7 | EIF4E | 869 | 3.123 | 0.6712 | Yes | ||
| 8 | EIF2B1 | 1420 | 2.431 | 0.6872 | Yes | ||
| 9 | EIF2B2 | 1429 | 2.424 | 0.7322 | Yes | ||
| 10 | EIF4G2 | 1637 | 2.241 | 0.7631 | Yes | ||
| 11 | EIF4A2 | 2004 | 2.006 | 0.7811 | Yes | ||
| 12 | EIF2S1 | 2158 | 1.922 | 0.8089 | Yes | ||
| 13 | EIF4G1 | 3294 | 1.441 | 0.7750 | No | ||
| 14 | EIF2C1 | 10443 | -0.156 | 0.3936 | No | ||
| 15 | EIF2B4 | 13978 | -1.022 | 0.2228 | No | ||
| 16 | EIF4H | 15031 | -1.412 | 0.1927 | No |