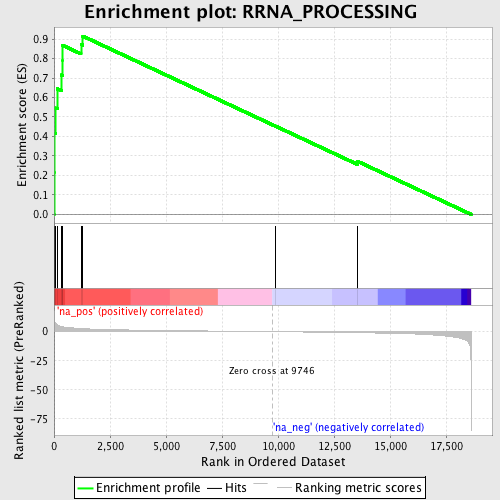
Profile of the Running ES Score & Positions of GeneSet Members on the Rank Ordered List
| Dataset | set03_absentNotch_versus_normalThy |
| Phenotype | NoPhenotypeAvailable |
| Upregulated in class | na_pos |
| GeneSet | RRNA_PROCESSING |
| Enrichment Score (ES) | 0.9149472 |
| Normalized Enrichment Score (NES) | 2.2710593 |
| Nominal p-value | 0.0 |
| FDR q-value | 2.69802E-4 |
| FWER p-Value | 0.0010 |
| PROBE | GENE SYMBOL | GENE_TITLE | RANK IN GENE LIST | RANK METRIC SCORE | RUNNING ES | CORE ENRICHMENT | |
|---|---|---|---|---|---|---|---|
| 1 | NOLA2 | 4 | 11.884 | 0.2172 | Yes | ||
| 2 | FBL | 8 | 10.854 | 0.4156 | Yes | ||
| 3 | NOLC1 | 54 | 7.270 | 0.5462 | Yes | ||
| 4 | RRP9 | 142 | 5.644 | 0.6448 | Yes | ||
| 5 | NOL5A | 328 | 4.416 | 0.7157 | Yes | ||
| 6 | EXOSC2 | 377 | 4.233 | 0.7905 | Yes | ||
| 7 | POP4 | 381 | 4.221 | 0.8676 | Yes | ||
| 8 | EXOSC7 | 1201 | 2.663 | 0.8723 | Yes | ||
| 9 | GEMIN4 | 1280 | 2.560 | 0.9149 | Yes | ||
| 10 | EXOSC3 | 9889 | -0.030 | 0.4529 | No | ||
| 11 | RPS14 | 13536 | -0.882 | 0.2730 | No |