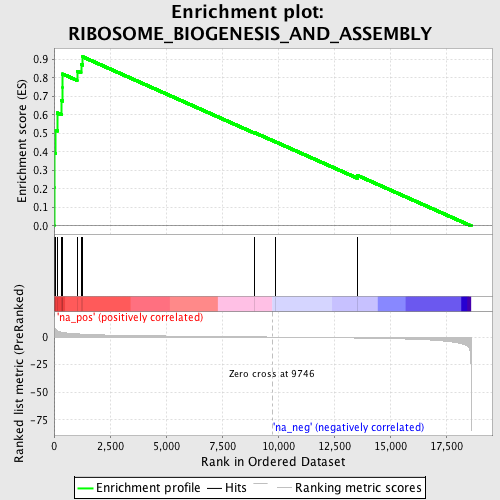
Profile of the Running ES Score & Positions of GeneSet Members on the Rank Ordered List
| Dataset | set03_absentNotch_versus_normalThy |
| Phenotype | NoPhenotypeAvailable |
| Upregulated in class | na_pos |
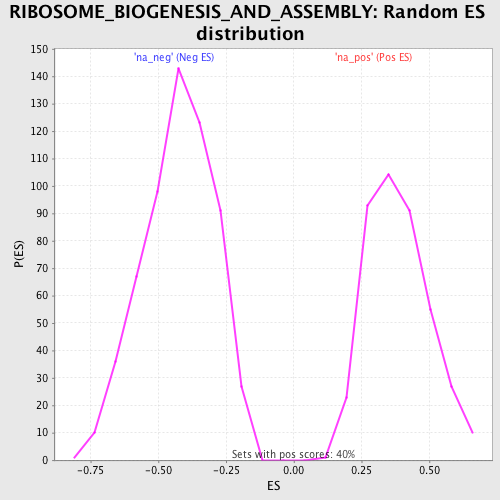
| GeneSet | RIBOSOME_BIOGENESIS_AND_ASSEMBLY |
| Enrichment Score (ES) | 0.913008 |
| Normalized Enrichment Score (NES) | 2.3816025 |
| Nominal p-value | 0.0 |
| FDR q-value | 0.0 |
| FWER p-Value | 0.0 |
| PROBE | GENE SYMBOL | GENE_TITLE | RANK IN GENE LIST | RANK METRIC SCORE | RUNNING ES | CORE ENRICHMENT | |
|---|---|---|---|---|---|---|---|
| 1 | NOLA2 | 4 | 11.884 | 0.2057 | Yes | ||
| 2 | FBL | 8 | 10.854 | 0.3936 | Yes | ||
| 3 | NOLC1 | 54 | 7.270 | 0.5171 | Yes | ||
| 4 | RRP9 | 142 | 5.644 | 0.6102 | Yes | ||
| 5 | NOL5A | 328 | 4.416 | 0.6768 | Yes | ||
| 6 | EXOSC2 | 377 | 4.233 | 0.7476 | Yes | ||
| 7 | POP4 | 381 | 4.221 | 0.8205 | Yes | ||
| 8 | SDAD1 | 1024 | 2.893 | 0.8362 | Yes | ||
| 9 | EXOSC7 | 1201 | 2.663 | 0.8728 | Yes | ||
| 10 | GEMIN4 | 1280 | 2.560 | 0.9130 | Yes | ||
| 11 | NPM1 | 8937 | 0.166 | 0.5044 | No | ||
| 12 | EXOSC3 | 9889 | -0.030 | 0.4538 | No | ||
| 13 | RPS14 | 13536 | -0.882 | 0.2731 | No |