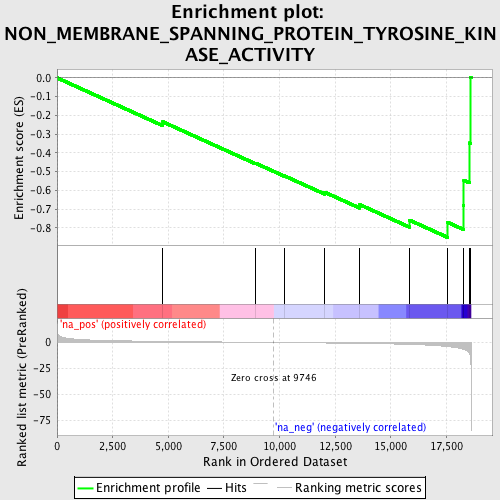
Profile of the Running ES Score & Positions of GeneSet Members on the Rank Ordered List
| Dataset | set03_absentNotch_versus_normalThy |
| Phenotype | NoPhenotypeAvailable |
| Upregulated in class | na_neg |
| GeneSet | NON_MEMBRANE_SPANNING_PROTEIN_TYROSINE_KINASE_ACTIVITY |
| Enrichment Score (ES) | -0.85137963 |
| Normalized Enrichment Score (NES) | -1.9144822 |
| Nominal p-value | 0.0 |
| FDR q-value | 1.0 |
| FWER p-Value | 0.68 |
| PROBE | GENE SYMBOL | GENE_TITLE | RANK IN GENE LIST | RANK METRIC SCORE | RUNNING ES | CORE ENRICHMENT | |
|---|---|---|---|---|---|---|---|
| 1 | ERBB2 | 4752 | 1.016 | -0.2347 | No | ||
| 2 | TXK | 8933 | 0.166 | -0.4560 | No | ||
| 3 | PTK6 | 10202 | -0.102 | -0.5220 | No | ||
| 4 | FRK | 12026 | -0.490 | -0.6100 | No | ||
| 5 | TYK2 | 13602 | -0.905 | -0.6762 | No | ||
| 6 | CLK1 | 15833 | -1.834 | -0.7587 | No | ||
| 7 | TNK2 | 17559 | -3.937 | -0.7711 | Yes | ||
| 8 | ITK | 18258 | -6.356 | -0.6791 | Yes | ||
| 9 | DYRK1A | 18283 | -6.537 | -0.5471 | Yes | ||
| 10 | PTK2B | 18534 | -10.458 | -0.3473 | Yes | ||
| 11 | TEC | 18590 | -17.252 | 0.0014 | Yes |