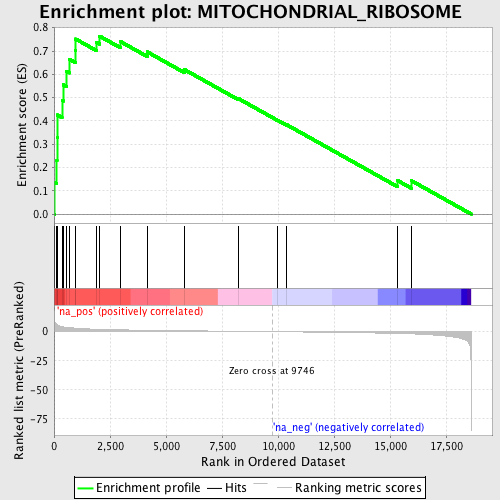
Profile of the Running ES Score & Positions of GeneSet Members on the Rank Ordered List
| Dataset | set03_absentNotch_versus_normalThy |
| Phenotype | NoPhenotypeAvailable |
| Upregulated in class | na_pos |
| GeneSet | MITOCHONDRIAL_RIBOSOME |
| Enrichment Score (ES) | 0.7639108 |
| Normalized Enrichment Score (NES) | 2.2078047 |
| Nominal p-value | 0.0 |
| FDR q-value | 2.2449833E-4 |
| FWER p-Value | 0.0020 |
| PROBE | GENE SYMBOL | GENE_TITLE | RANK IN GENE LIST | RANK METRIC SCORE | RUNNING ES | CORE ENRICHMENT | |
|---|---|---|---|---|---|---|---|
| 1 | MRPS10 | 33 | 7.986 | 0.1350 | Yes | ||
| 2 | MRPL12 | 121 | 5.858 | 0.2306 | Yes | ||
| 3 | MRPS15 | 131 | 5.762 | 0.3287 | Yes | ||
| 4 | MRPS28 | 139 | 5.675 | 0.4255 | Yes | ||
| 5 | MRPL55 | 356 | 4.310 | 0.4877 | Yes | ||
| 6 | MRPS18A | 405 | 4.118 | 0.5556 | Yes | ||
| 7 | MRPS24 | 550 | 3.744 | 0.6120 | Yes | ||
| 8 | MRPS35 | 672 | 3.448 | 0.6645 | Yes | ||
| 9 | MRPS11 | 944 | 3.003 | 0.7014 | Yes | ||
| 10 | MRPS12 | 958 | 2.976 | 0.7516 | Yes | ||
| 11 | MRPL51 | 1889 | 2.074 | 0.7371 | Yes | ||
| 12 | MRPS18C | 2028 | 1.997 | 0.7639 | Yes | ||
| 13 | MRPL10 | 2955 | 1.561 | 0.7409 | No | ||
| 14 | MRPS16 | 4157 | 1.164 | 0.6962 | No | ||
| 15 | MRPS22 | 5820 | 0.776 | 0.6201 | No | ||
| 16 | MRPL52 | 8235 | 0.295 | 0.4954 | No | ||
| 17 | MRPL40 | 9979 | -0.055 | 0.4026 | No | ||
| 18 | MRPS36 | 10387 | -0.144 | 0.3832 | No | ||
| 19 | MRPS21 | 15332 | -1.556 | 0.1439 | No | ||
| 20 | MRPL23 | 15945 | -1.903 | 0.1436 | No |