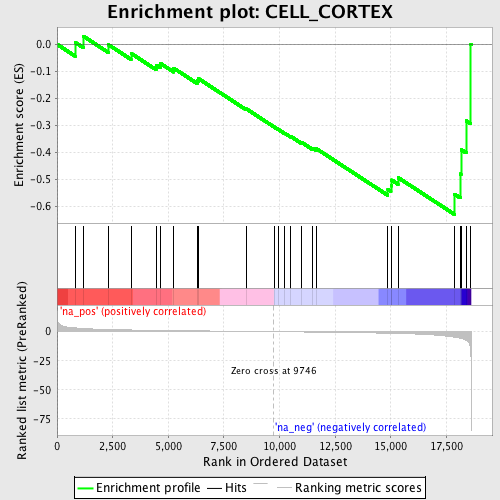
Profile of the Running ES Score & Positions of GeneSet Members on the Rank Ordered List
| Dataset | set03_absentNotch_versus_normalThy |
| Phenotype | NoPhenotypeAvailable |
| Upregulated in class | na_neg |
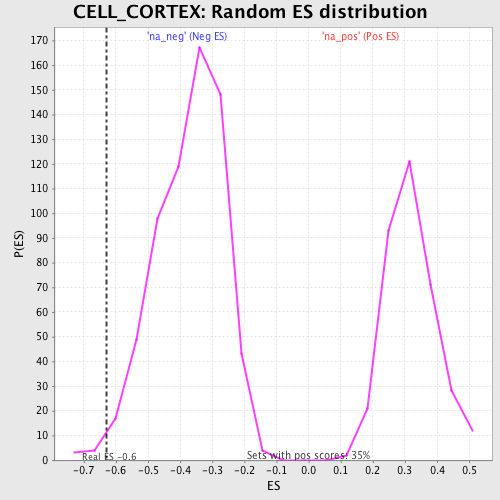
| GeneSet | CELL_CORTEX |
| Enrichment Score (ES) | -0.6295623 |
| Normalized Enrichment Score (NES) | -1.6987927 |
| Nominal p-value | 0.010736196 |
| FDR q-value | 0.6233416 |
| FWER p-Value | 1.0 |
| PROBE | GENE SYMBOL | GENE_TITLE | RANK IN GENE LIST | RANK METRIC SCORE | RUNNING ES | CORE ENRICHMENT | |
|---|---|---|---|---|---|---|---|
| 1 | CNKSR1 | 813 | 3.209 | 0.0070 | No | ||
| 2 | NCL | 1174 | 2.702 | 0.0304 | No | ||
| 3 | MYH10 | 2317 | 1.841 | -0.0018 | No | ||
| 4 | ANLN | 3327 | 1.427 | -0.0335 | No | ||
| 5 | TRPC4 | 4453 | 1.088 | -0.0768 | No | ||
| 6 | LASP1 | 4638 | 1.048 | -0.0702 | No | ||
| 7 | CTTN | 5240 | 0.900 | -0.0883 | No | ||
| 8 | ARFIP2 | 6296 | 0.678 | -0.1343 | No | ||
| 9 | CLASP1 | 6360 | 0.662 | -0.1272 | No | ||
| 10 | SPINK5 | 8509 | 0.241 | -0.2389 | No | ||
| 11 | MYO6 | 9775 | -0.008 | -0.3068 | No | ||
| 12 | TSC1 | 9944 | -0.045 | -0.3151 | No | ||
| 13 | MAPRE1 | 10217 | -0.105 | -0.3281 | No | ||
| 14 | DBNL | 10498 | -0.168 | -0.3405 | No | ||
| 15 | GYS2 | 10982 | -0.264 | -0.3623 | No | ||
| 16 | ARF6 | 11489 | -0.371 | -0.3837 | No | ||
| 17 | SLC4A1 | 11652 | -0.407 | -0.3859 | No | ||
| 18 | GIPC1 | 14868 | -1.345 | -0.5376 | No | ||
| 19 | SPTBN4 | 15008 | -1.401 | -0.5229 | No | ||
| 20 | PRKCI | 15034 | -1.413 | -0.5019 | No | ||
| 21 | GYPC | 15327 | -1.554 | -0.4930 | No | ||
| 22 | PAFAH1B1 | 17867 | -4.737 | -0.5546 | Yes | ||
| 23 | PSCDBP | 18126 | -5.624 | -0.4795 | Yes | ||
| 24 | MYH9 | 18160 | -5.806 | -0.3894 | Yes | ||
| 25 | MYO9B | 18389 | -7.493 | -0.2831 | Yes | ||
| 26 | SCIN | 18596 | -18.657 | 0.0011 | Yes |