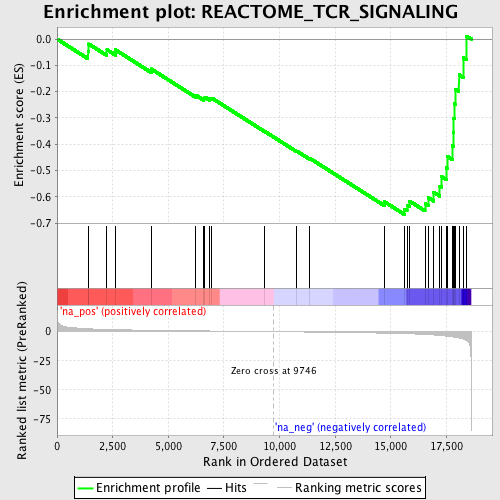
Profile of the Running ES Score & Positions of GeneSet Members on the Rank Ordered List
| Dataset | set03_absentNotch_versus_normalThy |
| Phenotype | NoPhenotypeAvailable |
| Upregulated in class | na_neg |
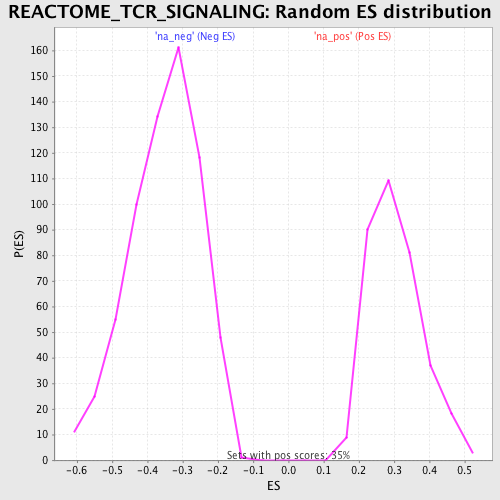
| GeneSet | REACTOME_TCR_SIGNALING |
| Enrichment Score (ES) | -0.6671626 |
| Normalized Enrichment Score (NES) | -1.8931653 |
| Nominal p-value | 0.0 |
| FDR q-value | 0.12447175 |
| FWER p-Value | 0.627 |
| PROBE | GENE SYMBOL | GENE_TITLE | RANK IN GENE LIST | RANK METRIC SCORE | RUNNING ES | CORE ENRICHMENT | |
|---|---|---|---|---|---|---|---|
| 1 | ENAH | 1388 | 2.463 | -0.0456 | No | ||
| 2 | PTPRC | 1422 | 2.430 | -0.0186 | No | ||
| 3 | NCK1 | 2241 | 1.878 | -0.0404 | No | ||
| 4 | PLCG1 | 2622 | 1.699 | -0.0407 | No | ||
| 5 | MAP3K7 | 4229 | 1.146 | -0.1136 | No | ||
| 6 | PIK3R1 | 6233 | 0.693 | -0.2132 | No | ||
| 7 | GRAP2 | 6593 | 0.616 | -0.2252 | No | ||
| 8 | NFKB1 | 6645 | 0.606 | -0.2208 | No | ||
| 9 | CHUK | 6859 | 0.560 | -0.2256 | No | ||
| 10 | UBE2N | 6955 | 0.539 | -0.2244 | No | ||
| 11 | PIK3CB | 9318 | 0.093 | -0.3504 | No | ||
| 12 | FYB | 10768 | -0.220 | -0.4257 | No | ||
| 13 | PAK1 | 11346 | -0.340 | -0.4527 | No | ||
| 14 | IKBKB | 14715 | -1.283 | -0.6188 | No | ||
| 15 | ZAP70 | 15615 | -1.707 | -0.6470 | Yes | ||
| 16 | LAT | 15730 | -1.775 | -0.6321 | Yes | ||
| 17 | PTEN | 15842 | -1.843 | -0.6163 | Yes | ||
| 18 | CSK | 16538 | -2.400 | -0.6253 | Yes | ||
| 19 | NFKBIA | 16685 | -2.540 | -0.6031 | Yes | ||
| 20 | CD3D | 16927 | -2.841 | -0.5825 | Yes | ||
| 21 | RIPK2 | 17205 | -3.242 | -0.5590 | Yes | ||
| 22 | LCK | 17279 | -3.355 | -0.5233 | Yes | ||
| 23 | RELA | 17490 | -3.802 | -0.4896 | Yes | ||
| 24 | BCL10 | 17534 | -3.900 | -0.4458 | Yes | ||
| 25 | WAS | 17765 | -4.434 | -0.4057 | Yes | ||
| 26 | CD3G | 17824 | -4.591 | -0.3546 | Yes | ||
| 27 | LCP2 | 17831 | -4.615 | -0.3003 | Yes | ||
| 28 | PRKCQ | 17869 | -4.739 | -0.2462 | Yes | ||
| 29 | CD4 | 17903 | -4.846 | -0.1907 | Yes | ||
| 30 | PDPK1 | 18064 | -5.362 | -0.1359 | Yes | ||
| 31 | ITK | 18258 | -6.356 | -0.0711 | Yes | ||
| 32 | CD3E | 18405 | -7.633 | 0.0114 | Yes |