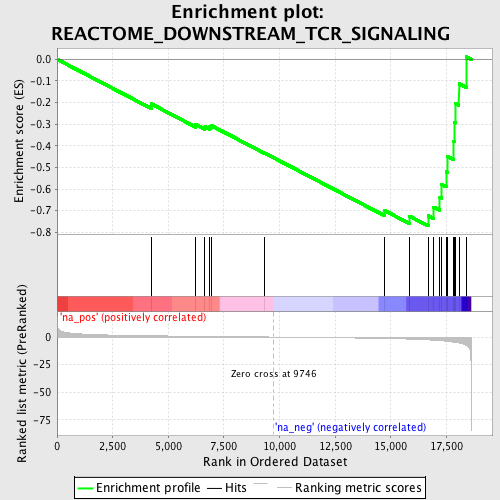
Profile of the Running ES Score & Positions of GeneSet Members on the Rank Ordered List
| Dataset | set03_absentNotch_versus_normalThy |
| Phenotype | NoPhenotypeAvailable |
| Upregulated in class | na_neg |
| GeneSet | REACTOME_DOWNSTREAM_TCR_SIGNALING |
| Enrichment Score (ES) | -0.7705937 |
| Normalized Enrichment Score (NES) | -1.9612064 |
| Nominal p-value | 0.0 |
| FDR q-value | 0.09003015 |
| FWER p-Value | 0.4 |
| PROBE | GENE SYMBOL | GENE_TITLE | RANK IN GENE LIST | RANK METRIC SCORE | RUNNING ES | CORE ENRICHMENT | |
|---|---|---|---|---|---|---|---|
| 1 | MAP3K7 | 4229 | 1.146 | -0.2060 | No | ||
| 2 | PIK3R1 | 6233 | 0.693 | -0.3008 | No | ||
| 3 | NFKB1 | 6645 | 0.606 | -0.3116 | No | ||
| 4 | CHUK | 6859 | 0.560 | -0.3126 | No | ||
| 5 | UBE2N | 6955 | 0.539 | -0.3077 | No | ||
| 6 | PIK3CB | 9318 | 0.093 | -0.4329 | No | ||
| 7 | IKBKB | 14715 | -1.283 | -0.6991 | No | ||
| 8 | PTEN | 15842 | -1.843 | -0.7253 | Yes | ||
| 9 | NFKBIA | 16685 | -2.540 | -0.7232 | Yes | ||
| 10 | CD3D | 16927 | -2.841 | -0.6832 | Yes | ||
| 11 | RIPK2 | 17205 | -3.242 | -0.6376 | Yes | ||
| 12 | LCK | 17279 | -3.355 | -0.5790 | Yes | ||
| 13 | RELA | 17490 | -3.802 | -0.5193 | Yes | ||
| 14 | BCL10 | 17534 | -3.900 | -0.4489 | Yes | ||
| 15 | CD3G | 17824 | -4.591 | -0.3788 | Yes | ||
| 16 | PRKCQ | 17869 | -4.739 | -0.2928 | Yes | ||
| 17 | CD4 | 17903 | -4.846 | -0.2042 | Yes | ||
| 18 | PDPK1 | 18064 | -5.362 | -0.1128 | Yes | ||
| 19 | CD3E | 18405 | -7.633 | 0.0113 | Yes |
