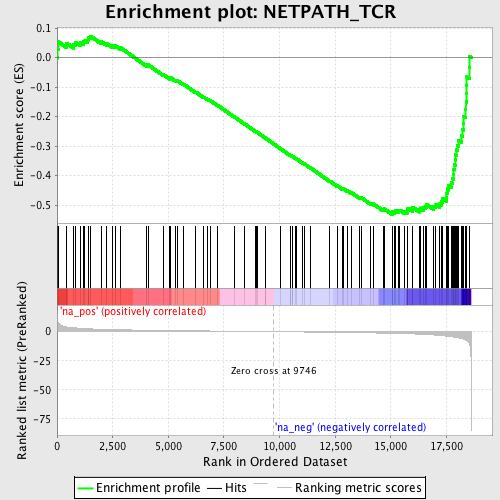
Profile of the Running ES Score & Positions of GeneSet Members on the Rank Ordered List
| Dataset | set03_absentNotch_versus_normalThy |
| Phenotype | NoPhenotypeAvailable |
| Upregulated in class | na_neg |
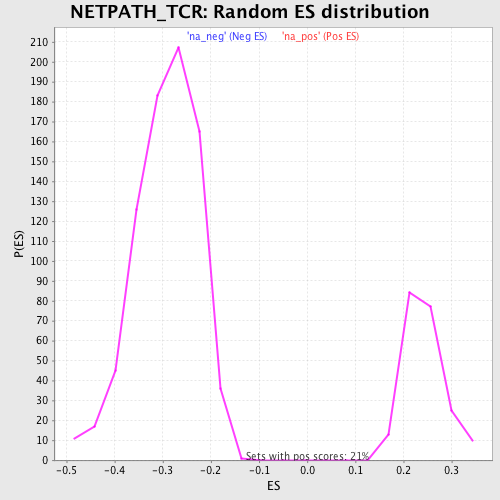
| GeneSet | NETPATH_TCR |
| Enrichment Score (ES) | -0.53173393 |
| Normalized Enrichment Score (NES) | -1.8263636 |
| Nominal p-value | 0.0 |
| FDR q-value | 0.12688164 |
| FWER p-Value | 0.826 |
| PROBE | GENE SYMBOL | GENE_TITLE | RANK IN GENE LIST | RANK METRIC SCORE | RUNNING ES | CORE ENRICHMENT | |
|---|---|---|---|---|---|---|---|
| 1 | CEBPB | 31 | 8.104 | 0.0285 | No | ||
| 2 | PTK2 | 64 | 7.089 | 0.0531 | No | ||
| 3 | UNC119 | 428 | 4.055 | 0.0486 | No | ||
| 4 | GRB2 | 736 | 3.346 | 0.0444 | No | ||
| 5 | CRK | 816 | 3.207 | 0.0521 | No | ||
| 6 | YWHAQ | 1040 | 2.880 | 0.0508 | No | ||
| 7 | NCL | 1174 | 2.702 | 0.0536 | No | ||
| 8 | STAT5A | 1251 | 2.601 | 0.0592 | No | ||
| 9 | ENAH | 1388 | 2.463 | 0.0610 | No | ||
| 10 | PTPRC | 1422 | 2.430 | 0.0683 | No | ||
| 11 | PIK3R2 | 1505 | 2.342 | 0.0726 | No | ||
| 12 | DUSP3 | 1992 | 2.016 | 0.0538 | No | ||
| 13 | NCK1 | 2241 | 1.878 | 0.0474 | No | ||
| 14 | CDC42 | 2501 | 1.755 | 0.0399 | No | ||
| 15 | PLCG1 | 2622 | 1.699 | 0.0398 | No | ||
| 16 | SHB | 2837 | 1.611 | 0.0342 | No | ||
| 17 | ARHGEF6 | 4012 | 1.202 | -0.0247 | No | ||
| 18 | STK39 | 4090 | 1.182 | -0.0245 | No | ||
| 19 | PTPN22 | 4789 | 1.008 | -0.0585 | No | ||
| 20 | CREB1 | 5058 | 0.945 | -0.0694 | No | ||
| 21 | GAB2 | 5106 | 0.933 | -0.0685 | No | ||
| 22 | KHDRBS1 | 5317 | 0.881 | -0.0766 | No | ||
| 23 | LYN | 5405 | 0.860 | -0.0781 | No | ||
| 24 | HOMER3 | 5677 | 0.804 | -0.0897 | No | ||
| 25 | PIK3R1 | 6233 | 0.693 | -0.1171 | No | ||
| 26 | GRAP2 | 6593 | 0.616 | -0.1342 | No | ||
| 27 | INSL3 | 6760 | 0.579 | -0.1410 | No | ||
| 28 | AKT1 | 6874 | 0.557 | -0.1451 | No | ||
| 29 | RAP1A | 7210 | 0.489 | -0.1613 | No | ||
| 30 | CREBBP | 7951 | 0.345 | -0.2000 | No | ||
| 31 | PTPRJ | 8443 | 0.256 | -0.2256 | No | ||
| 32 | TXK | 8933 | 0.166 | -0.2514 | No | ||
| 33 | PAG1 | 8962 | 0.161 | -0.2523 | No | ||
| 34 | TUBB2A | 8995 | 0.155 | -0.2535 | No | ||
| 35 | MAP2K1 | 9344 | 0.087 | -0.2719 | No | ||
| 36 | PTPRH | 9387 | 0.080 | -0.2739 | No | ||
| 37 | SKAP2 | 10048 | -0.068 | -0.3093 | No | ||
| 38 | DBNL | 10498 | -0.168 | -0.3329 | No | ||
| 39 | JUN | 10501 | -0.169 | -0.3324 | No | ||
| 40 | SOS1 | 10560 | -0.179 | -0.3349 | No | ||
| 41 | CD2AP | 10571 | -0.181 | -0.3348 | No | ||
| 42 | PTPN3 | 10707 | -0.206 | -0.3413 | No | ||
| 43 | FYB | 10768 | -0.220 | -0.3437 | No | ||
| 44 | SLA | 11015 | -0.272 | -0.3560 | No | ||
| 45 | FOS | 11102 | -0.290 | -0.3595 | No | ||
| 46 | ABI1 | 11378 | -0.346 | -0.3731 | No | ||
| 47 | SOS2 | 12257 | -0.546 | -0.4185 | No | ||
| 48 | NFATC2 | 12580 | -0.623 | -0.4336 | No | ||
| 49 | CBLB | 12833 | -0.686 | -0.4446 | No | ||
| 50 | JAK3 | 12893 | -0.700 | -0.4452 | No | ||
| 51 | DLG1 | 13037 | -0.740 | -0.4502 | No | ||
| 52 | SRC | 13221 | -0.790 | -0.4571 | No | ||
| 53 | SH3BP2 | 13603 | -0.905 | -0.4744 | No | ||
| 54 | ARHGEF7 | 13668 | -0.920 | -0.4744 | No | ||
| 55 | ACP1 | 14089 | -1.060 | -0.4931 | No | ||
| 56 | SYK | 14216 | -1.106 | -0.4958 | No | ||
| 57 | WIPF1 | 14652 | -1.255 | -0.5147 | No | ||
| 58 | RASA1 | 14704 | -1.279 | -0.5127 | No | ||
| 59 | SH2D3C | 15058 | -1.425 | -0.5264 | Yes | ||
| 60 | RAPGEF1 | 15065 | -1.427 | -0.5214 | Yes | ||
| 61 | PTPN11 | 15185 | -1.479 | -0.5224 | Yes | ||
| 62 | MAPK1 | 15209 | -1.490 | -0.5181 | Yes | ||
| 63 | GRAP | 15333 | -1.556 | -0.5189 | Yes | ||
| 64 | ABL1 | 15410 | -1.599 | -0.5171 | Yes | ||
| 65 | ZAP70 | 15615 | -1.707 | -0.5218 | Yes | ||
| 66 | LAT | 15730 | -1.775 | -0.5213 | Yes | ||
| 67 | VAV3 | 15745 | -1.781 | -0.5155 | Yes | ||
| 68 | DTX1 | 15765 | -1.792 | -0.5098 | Yes | ||
| 69 | PTPN6 | 15968 | -1.915 | -0.5136 | Yes | ||
| 70 | STAT5B | 15983 | -1.926 | -0.5072 | Yes | ||
| 71 | MAP4K1 | 16285 | -2.168 | -0.5154 | Yes | ||
| 72 | SHC1 | 16333 | -2.217 | -0.5097 | Yes | ||
| 73 | VASP | 16467 | -2.333 | -0.5082 | Yes | ||
| 74 | ARHGDIB | 16545 | -2.410 | -0.5034 | Yes | ||
| 75 | TUBA4A | 16610 | -2.465 | -0.4977 | Yes | ||
| 76 | CD3D | 16927 | -2.841 | -0.5042 | Yes | ||
| 77 | WASF2 | 17028 | -2.961 | -0.4986 | Yes | ||
| 78 | RIPK2 | 17205 | -3.242 | -0.4960 | Yes | ||
| 79 | LCK | 17279 | -3.355 | -0.4875 | Yes | ||
| 80 | PTPN12 | 17332 | -3.453 | -0.4774 | Yes | ||
| 81 | DOCK2 | 17503 | -3.826 | -0.4724 | Yes | ||
| 82 | DNM2 | 17521 | -3.871 | -0.4589 | Yes | ||
| 83 | BCL10 | 17534 | -3.900 | -0.4451 | Yes | ||
| 84 | CBL | 17607 | -4.019 | -0.4340 | Yes | ||
| 85 | EVL | 17728 | -4.326 | -0.4244 | Yes | ||
| 86 | WAS | 17765 | -4.434 | -0.4098 | Yes | ||
| 87 | CD3G | 17824 | -4.591 | -0.3959 | Yes | ||
| 88 | LCP2 | 17831 | -4.615 | -0.3791 | Yes | ||
| 89 | PRKCQ | 17869 | -4.739 | -0.3634 | Yes | ||
| 90 | CRKL | 17893 | -4.821 | -0.3467 | Yes | ||
| 91 | CD4 | 17903 | -4.846 | -0.3292 | Yes | ||
| 92 | VAV1 | 17943 | -4.944 | -0.3129 | Yes | ||
| 93 | PSTPIP1 | 17987 | -5.065 | -0.2964 | Yes | ||
| 94 | FYN | 18056 | -5.334 | -0.2802 | Yes | ||
| 95 | CARD11 | 18184 | -5.916 | -0.2651 | Yes | ||
| 96 | CD247 | 18236 | -6.229 | -0.2447 | Yes | ||
| 97 | ITK | 18258 | -6.356 | -0.2222 | Yes | ||
| 98 | SH2D2A | 18280 | -6.523 | -0.1990 | Yes | ||
| 99 | DEF6 | 18368 | -7.309 | -0.1765 | Yes | ||
| 100 | NEDD9 | 18379 | -7.388 | -0.1496 | Yes | ||
| 101 | CD3E | 18405 | -7.633 | -0.1226 | Yes | ||
| 102 | GIT2 | 18409 | -7.660 | -0.0942 | Yes | ||
| 103 | CISH | 18418 | -7.783 | -0.0657 | Yes | ||
| 104 | CD5 | 18527 | -10.056 | -0.0341 | Yes | ||
| 105 | PTK2B | 18534 | -10.458 | 0.0044 | Yes |