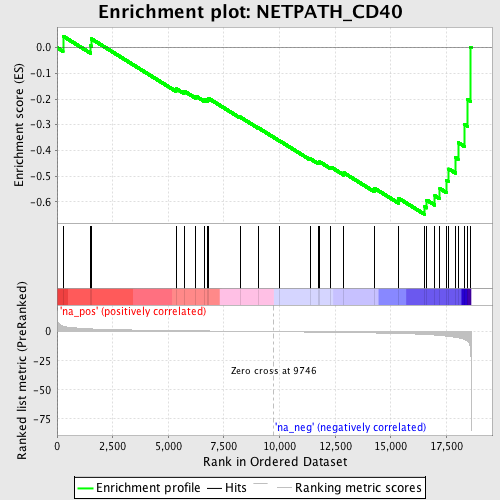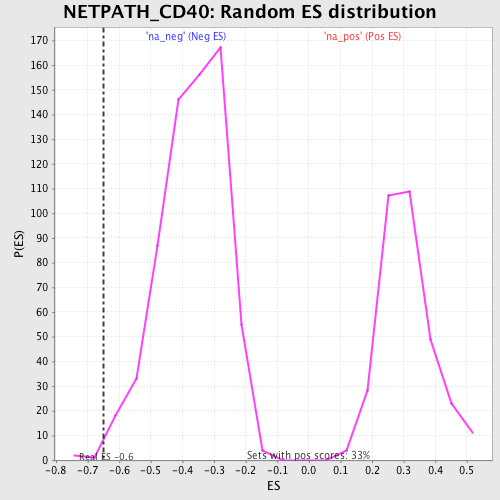
Profile of the Running ES Score & Positions of GeneSet Members on the Rank Ordered List
| Dataset | set03_absentNotch_versus_normalThy |
| Phenotype | NoPhenotypeAvailable |
| Upregulated in class | na_neg |
| GeneSet | NETPATH_CD40 |
| Enrichment Score (ES) | -0.64927423 |
| Normalized Enrichment Score (NES) | -1.7777346 |
| Nominal p-value | 0.004484305 |
| FDR q-value | 0.11874254 |
| FWER p-Value | 0.916 |

| PROBE | GENE SYMBOL | GENE_TITLE | RANK IN GENE LIST | RANK METRIC SCORE | RUNNING ES | CORE ENRICHMENT | |
|---|---|---|---|---|---|---|---|
| 1 | XRCC6 | 266 | 4.731 | 0.0447 | No | ||
| 2 | PIK3R2 | 1505 | 2.342 | 0.0073 | No | ||
| 3 | TRAF6 | 1541 | 2.310 | 0.0342 | No | ||
| 4 | RAF1 | 5344 | 0.875 | -0.1594 | No | ||
| 5 | CAV1 | 5707 | 0.798 | -0.1689 | No | ||
| 6 | PIK3R1 | 6233 | 0.693 | -0.1885 | No | ||
| 7 | NFKB1 | 6645 | 0.606 | -0.2031 | No | ||
| 8 | INSL3 | 6760 | 0.579 | -0.2020 | No | ||
| 9 | TP53 | 6813 | 0.567 | -0.1977 | No | ||
| 10 | XRCC5 | 8222 | 0.296 | -0.2698 | No | ||
| 11 | HRAS | 9039 | 0.147 | -0.3119 | No | ||
| 12 | RHOD | 10017 | -0.063 | -0.3636 | No | ||
| 13 | CD40LG | 11379 | -0.346 | -0.4325 | No | ||
| 14 | TRAF5 | 11737 | -0.427 | -0.4464 | No | ||
| 15 | REL | 11773 | -0.433 | -0.4429 | No | ||
| 16 | BIRC2 | 12309 | -0.559 | -0.4647 | No | ||
| 17 | JAK3 | 12893 | -0.700 | -0.4874 | No | ||
| 18 | TTRAP | 14252 | -1.120 | -0.5464 | No | ||
| 19 | BIRC3 | 15345 | -1.560 | -0.5857 | No | ||
| 20 | CD40 | 16527 | -2.391 | -0.6195 | Yes | ||
| 21 | RELB | 16614 | -2.472 | -0.5932 | Yes | ||
| 22 | NFKB2 | 16979 | -2.902 | -0.5766 | Yes | ||
| 23 | MAP3K8 | 17204 | -3.241 | -0.5482 | Yes | ||
| 24 | RELA | 17490 | -3.802 | -0.5162 | Yes | ||
| 25 | CBL | 17607 | -4.019 | -0.4723 | Yes | ||
| 26 | STAT3 | 17907 | -4.850 | -0.4279 | Yes | ||
| 27 | TRAF2 | 18025 | -5.204 | -0.3692 | Yes | ||
| 28 | TRAF3 | 18317 | -6.862 | -0.2993 | Yes | ||
| 29 | TRAF1 | 18458 | -8.368 | -0.2024 | Yes | ||
| 30 | IL4R | 18586 | -16.906 | 0.0016 | Yes |
