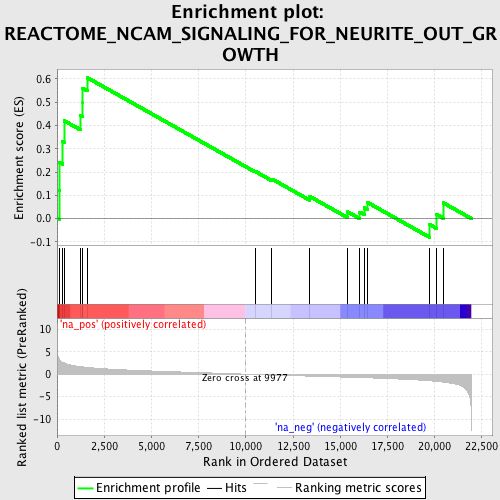
Profile of the Running ES Score & Positions of GeneSet Members on the Rank Ordered List
| Dataset | set02_ATM_minus_versus_BT_ATM_minus |
| Phenotype | NoPhenotypeAvailable |
| Upregulated in class | na_pos |
| GeneSet | REACTOME_NCAM_SIGNALING_FOR_NEURITE_OUT_GROWTH |
| Enrichment Score (ES) | 0.60601515 |
| Normalized Enrichment Score (NES) | 1.8714907 |
| Nominal p-value | 0.005076142 |
| FDR q-value | 0.11575014 |
| FWER p-Value | 0.515 |
| PROBE | GENE SYMBOL | GENE_TITLE | RANK IN GENE LIST | RANK METRIC SCORE | RUNNING ES | CORE ENRICHMENT | |
|---|---|---|---|---|---|---|---|
| 1 | RPS6KA5 | 107 | 3.380 | 0.1210 | Yes | ||
| 2 | CREB1 | 126 | 3.257 | 0.2414 | Yes | ||
| 3 | GFRA1 | 292 | 2.629 | 0.3318 | Yes | ||
| 4 | SOS1 | 370 | 2.483 | 0.4207 | Yes | ||
| 5 | PRNP | 1232 | 1.690 | 0.4444 | Yes | ||
| 6 | NCAM1 | 1348 | 1.630 | 0.4998 | Yes | ||
| 7 | PTPRA | 1352 | 1.628 | 0.5603 | Yes | ||
| 8 | MAPK1 | 1594 | 1.523 | 0.6060 | Yes | ||
| 9 | PSPN | 10493 | -0.077 | 0.2032 | No | ||
| 10 | RAF1 | 11386 | -0.204 | 0.1701 | No | ||
| 11 | KRAS | 13393 | -0.438 | 0.0949 | No | ||
| 12 | MAPK3 | 15401 | -0.677 | 0.0286 | No | ||
| 13 | MAP2K2 | 16032 | -0.762 | 0.0282 | No | ||
| 14 | CNTN2 | 16277 | -0.794 | 0.0467 | No | ||
| 15 | YWHAB | 16464 | -0.818 | 0.0687 | No | ||
| 16 | PTK2 | 19751 | -1.476 | -0.0262 | No | ||
| 17 | FYN | 20107 | -1.612 | 0.0176 | No | ||
| 18 | MAP2K1 | 20473 | -1.779 | 0.0672 | No |
