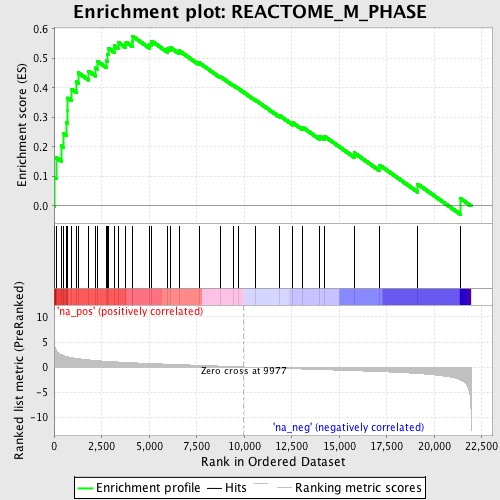
Profile of the Running ES Score & Positions of GeneSet Members on the Rank Ordered List
| Dataset | set02_ATM_minus_versus_BT_ATM_minus |
| Phenotype | NoPhenotypeAvailable |
| Upregulated in class | na_pos |
| GeneSet | REACTOME_M_PHASE |
| Enrichment Score (ES) | 0.575502 |
| Normalized Enrichment Score (NES) | 2.1927767 |
| Nominal p-value | 0.0 |
| FDR q-value | 0.010611164 |
| FWER p-Value | 0.011 |
| PROBE | GENE SYMBOL | GENE_TITLE | RANK IN GENE LIST | RANK METRIC SCORE | RUNNING ES | CORE ENRICHMENT | |
|---|---|---|---|---|---|---|---|
| 1 | CENPE | 21 | 4.670 | 0.0975 | Yes | ||
| 2 | SMC1A | 110 | 3.359 | 0.1642 | Yes | ||
| 3 | CLASP2 | 384 | 2.455 | 0.2035 | Yes | ||
| 4 | PAFAH1B1 | 513 | 2.259 | 0.2453 | Yes | ||
| 5 | CKAP5 | 664 | 2.094 | 0.2825 | Yes | ||
| 6 | KIF23 | 717 | 2.037 | 0.3231 | Yes | ||
| 7 | MLF1IP | 719 | 2.033 | 0.3659 | Yes | ||
| 8 | CENPA | 937 | 1.859 | 0.3952 | Yes | ||
| 9 | TAOK1 | 1176 | 1.720 | 0.4205 | Yes | ||
| 10 | RANBP2 | 1268 | 1.670 | 0.4516 | Yes | ||
| 11 | CENPC1 | 1816 | 1.429 | 0.4567 | Yes | ||
| 12 | BUB3 | 2180 | 1.302 | 0.4676 | Yes | ||
| 13 | BUB1 | 2260 | 1.274 | 0.4908 | Yes | ||
| 14 | CLASP1 | 2741 | 1.140 | 0.4930 | Yes | ||
| 15 | CDC20 | 2828 | 1.122 | 0.5127 | Yes | ||
| 16 | MAPRE1 | 2852 | 1.117 | 0.5352 | Yes | ||
| 17 | CDCA8 | 3170 | 1.043 | 0.5427 | Yes | ||
| 18 | ERCC6L | 3367 | 0.998 | 0.5548 | Yes | ||
| 19 | NUP160 | 3780 | 0.912 | 0.5552 | Yes | ||
| 20 | STAG2 | 4119 | 0.852 | 0.5577 | Yes | ||
| 21 | KNTC1 | 4123 | 0.851 | 0.5755 | Yes | ||
| 22 | PLK1 | 5036 | 0.703 | 0.5487 | No | ||
| 23 | SGOL1 | 5135 | 0.690 | 0.5588 | No | ||
| 24 | KIF2A | 5971 | 0.564 | 0.5325 | No | ||
| 25 | PMF1 | 6114 | 0.542 | 0.5375 | No | ||
| 26 | RAD21 | 6579 | 0.476 | 0.5263 | No | ||
| 27 | XPO1 | 7628 | 0.335 | 0.4856 | No | ||
| 28 | MAD2L1 | 8752 | 0.183 | 0.4381 | No | ||
| 29 | NUP37 | 9417 | 0.087 | 0.4097 | No | ||
| 30 | SGOL2 | 9687 | 0.046 | 0.3984 | No | ||
| 31 | BIRC5 | 10590 | -0.093 | 0.3591 | No | ||
| 32 | ZW10 | 11856 | -0.258 | 0.3068 | No | ||
| 33 | BUB1B | 12571 | -0.341 | 0.2814 | No | ||
| 34 | NUP107 | 13083 | -0.401 | 0.2665 | No | ||
| 35 | KIF2B | 13981 | -0.507 | 0.2363 | No | ||
| 36 | KIF20A | 14219 | -0.535 | 0.2367 | No | ||
| 37 | RANGAP1 | 15793 | -0.727 | 0.1802 | No | ||
| 38 | NUP43 | 17142 | -0.914 | 0.1380 | No | ||
| 39 | PPP1CC | 19133 | -1.291 | 0.0744 | No | ||
| 40 | ZWINT | 21393 | -2.564 | 0.0253 | No |
