Profile of the Running ES Score & Positions of GeneSet Members on the Rank Ordered List
| Dataset | set02_ATM_minus_versus_BT_ATM_minus |
| Phenotype | NoPhenotypeAvailable |
| Upregulated in class | na_pos |
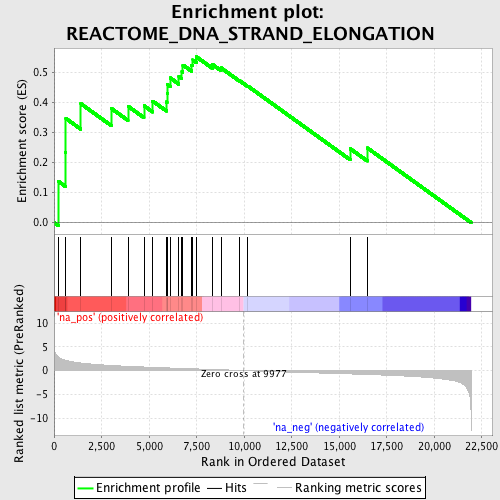
| GeneSet | REACTOME_DNA_STRAND_ELONGATION |
| Enrichment Score (ES) | 0.55275184 |
| Normalized Enrichment Score (NES) | 1.8747276 |
| Nominal p-value | 0.0025188916 |
| FDR q-value | 0.13348672 |
| FWER p-Value | 0.497 |
| PROBE | GENE SYMBOL | GENE_TITLE | RANK IN GENE LIST | RANK METRIC SCORE | RUNNING ES | CORE ENRICHMENT | |
|---|---|---|---|---|---|---|---|
| 1 | POLD3 | 240 | 2.785 | 0.1369 | Yes | ||
| 2 | RFC1 | 606 | 2.153 | 0.2345 | Yes | ||
| 3 | POLA1 | 621 | 2.138 | 0.3474 | Yes | ||
| 4 | MCM3 | 1409 | 1.600 | 0.3964 | Yes | ||
| 5 | CDC45L | 3011 | 1.081 | 0.3808 | Yes | ||
| 6 | RPA1 | 3890 | 0.893 | 0.3881 | Yes | ||
| 7 | MCM5 | 4731 | 0.752 | 0.3897 | Yes | ||
| 8 | RFC5 | 5190 | 0.682 | 0.4050 | Yes | ||
| 9 | MCM7 | 5913 | 0.572 | 0.4024 | Yes | ||
| 10 | MCM2 | 5944 | 0.567 | 0.4312 | Yes | ||
| 11 | FEN1 | 5963 | 0.565 | 0.4603 | Yes | ||
| 12 | PRIM1 | 6109 | 0.544 | 0.4826 | Yes | ||
| 13 | RFC2 | 6568 | 0.478 | 0.4871 | Yes | ||
| 14 | RPA2 | 6728 | 0.456 | 0.5040 | Yes | ||
| 15 | MCM6 | 6780 | 0.449 | 0.5255 | Yes | ||
| 16 | MCM4 | 7237 | 0.389 | 0.5254 | Yes | ||
| 17 | POLD1 | 7306 | 0.379 | 0.5424 | Yes | ||
| 18 | POLA2 | 7492 | 0.354 | 0.5528 | Yes | ||
| 19 | POLD2 | 8333 | 0.241 | 0.5272 | No | ||
| 20 | RFC4 | 8786 | 0.177 | 0.5160 | No | ||
| 21 | PCNA | 9779 | 0.031 | 0.4724 | No | ||
| 22 | RPA3 | 10199 | -0.033 | 0.4551 | No | ||
| 23 | LIG1 | 15585 | -0.699 | 0.2465 | No | ||
| 24 | RFC3 | 16485 | -0.821 | 0.2491 | No |
