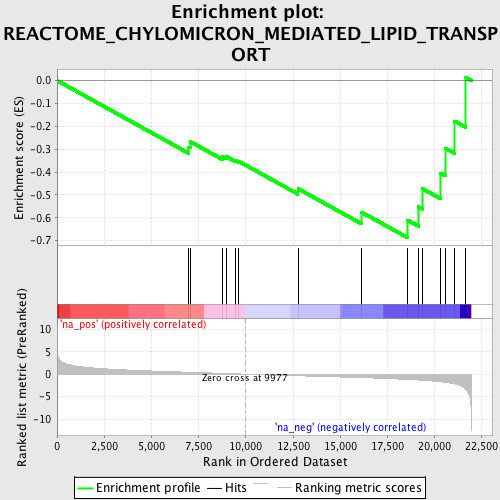
Profile of the Running ES Score & Positions of GeneSet Members on the Rank Ordered List
| Dataset | set02_ATM_minus_versus_BT_ATM_minus |
| Phenotype | NoPhenotypeAvailable |
| Upregulated in class | na_neg |
| GeneSet | REACTOME_CHYLOMICRON_MEDIATED_LIPID_TRANSPORT |
| Enrichment Score (ES) | -0.6859756 |
| Normalized Enrichment Score (NES) | -1.8724582 |
| Nominal p-value | 0.0017271157 |
| FDR q-value | 0.04289694 |
| FWER p-Value | 0.458 |

| PROBE | GENE SYMBOL | GENE_TITLE | RANK IN GENE LIST | RANK METRIC SCORE | RUNNING ES | CORE ENRICHMENT | |
|---|---|---|---|---|---|---|---|
| 1 | MTTP | 6984 | 0.422 | -0.2908 | No | ||
| 2 | LPL | 7072 | 0.410 | -0.2680 | No | ||
| 3 | LIPC | 8744 | 0.185 | -0.3321 | No | ||
| 4 | APOA5 | 8953 | 0.154 | -0.3315 | No | ||
| 5 | HSPG2 | 9466 | 0.079 | -0.3497 | No | ||
| 6 | APOA2 | 9627 | 0.055 | -0.3534 | No | ||
| 7 | APOC2 | 12764 | -0.363 | -0.4726 | No | ||
| 8 | APOB | 16113 | -0.772 | -0.5747 | No | ||
| 9 | APOC3 | 18555 | -1.165 | -0.6098 | Yes | ||
| 10 | APOA4 | 19157 | -1.298 | -0.5522 | Yes | ||
| 11 | APOA1 | 19366 | -1.357 | -0.4730 | Yes | ||
| 12 | LDLR | 20312 | -1.705 | -0.4045 | Yes | ||
| 13 | P4HB | 20590 | -1.841 | -0.2968 | Yes | ||
| 14 | LDLRAP1 | 21072 | -2.163 | -0.1772 | Yes | ||
| 15 | APOE | 21663 | -3.318 | 0.0129 | Yes |
