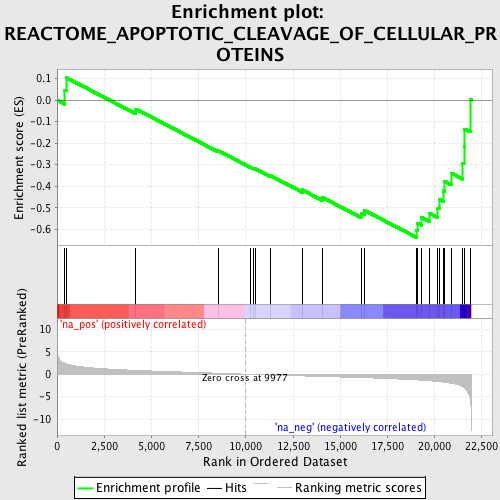
Profile of the Running ES Score & Positions of GeneSet Members on the Rank Ordered List
| Dataset | set02_ATM_minus_versus_BT_ATM_minus |
| Phenotype | NoPhenotypeAvailable |
| Upregulated in class | na_neg |
| GeneSet | REACTOME_APOPTOTIC_CLEAVAGE_OF_CELLULAR_PROTEINS |
| Enrichment Score (ES) | -0.63771707 |
| Normalized Enrichment Score (NES) | -1.9946357 |
| Nominal p-value | 0.0032786885 |
| FDR q-value | 0.025910428 |
| FWER p-Value | 0.118 |
| PROBE | GENE SYMBOL | GENE_TITLE | RANK IN GENE LIST | RANK METRIC SCORE | RUNNING ES | CORE ENRICHMENT | |
|---|---|---|---|---|---|---|---|
| 1 | CASP3 | 413 | 2.406 | 0.0456 | No | ||
| 2 | ROCK1 | 482 | 2.301 | 0.1040 | No | ||
| 3 | DSP | 4175 | 0.842 | -0.0418 | No | ||
| 4 | OCLN | 8533 | 0.214 | -0.2348 | No | ||
| 5 | DSG3 | 10245 | -0.041 | -0.3118 | No | ||
| 6 | BMX | 10425 | -0.068 | -0.3181 | No | ||
| 7 | LMNB1 | 10486 | -0.076 | -0.3188 | No | ||
| 8 | CDH1 | 11306 | -0.195 | -0.3510 | No | ||
| 9 | PKP1 | 12985 | -0.388 | -0.4171 | No | ||
| 10 | BIRC2 | 14071 | -0.516 | -0.4528 | No | ||
| 11 | FNTA | 16107 | -0.772 | -0.5249 | No | ||
| 12 | CASP8 | 16284 | -0.795 | -0.5117 | No | ||
| 13 | GAS2 | 19048 | -1.271 | -0.6037 | Yes | ||
| 14 | DSG2 | 19108 | -1.284 | -0.5720 | Yes | ||
| 15 | PRKCQ | 19298 | -1.339 | -0.5448 | Yes | ||
| 16 | PTK2 | 19751 | -1.476 | -0.5259 | Yes | ||
| 17 | CASP6 | 20177 | -1.642 | -0.5013 | Yes | ||
| 18 | BCAP31 | 20248 | -1.674 | -0.4597 | Yes | ||
| 19 | MAPT | 20458 | -1.770 | -0.4219 | Yes | ||
| 20 | PRKCD | 20514 | -1.805 | -0.3761 | Yes | ||
| 21 | PLEC1 | 20886 | -2.025 | -0.3388 | Yes | ||
| 22 | GSN | 21499 | -2.780 | -0.2923 | Yes | ||
| 23 | CASP7 | 21563 | -2.954 | -0.2161 | Yes | ||
| 24 | ADD1 | 21598 | -3.089 | -0.1350 | Yes | ||
| 25 | VIM | 21890 | -5.636 | 0.0026 | Yes |
