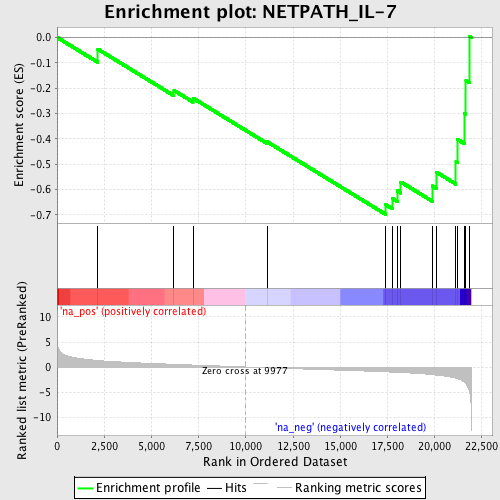
Profile of the Running ES Score & Positions of GeneSet Members on the Rank Ordered List
| Dataset | set02_ATM_minus_versus_BT_ATM_minus |
| Phenotype | NoPhenotypeAvailable |
| Upregulated in class | na_neg |
| GeneSet | NETPATH_IL-7 |
| Enrichment Score (ES) | -0.69856316 |
| Normalized Enrichment Score (NES) | -1.9085859 |
| Nominal p-value | 0.0051993066 |
| FDR q-value | 0.035323363 |
| FWER p-Value | 0.33 |
| PROBE | GENE SYMBOL | GENE_TITLE | RANK IN GENE LIST | RANK METRIC SCORE | RUNNING ES | CORE ENRICHMENT | |
|---|---|---|---|---|---|---|---|
| 1 | PIK3R1 | 2157 | 1.312 | -0.0462 | No | ||
| 2 | JAK1 | 6191 | 0.528 | -0.2091 | No | ||
| 3 | IRS2 | 7202 | 0.394 | -0.2395 | No | ||
| 4 | IRS1 | 11122 | -0.170 | -0.4114 | No | ||
| 5 | IL7R | 17421 | -0.957 | -0.6605 | Yes | ||
| 6 | STAT5A | 17775 | -1.018 | -0.6362 | Yes | ||
| 7 | MCL1 | 18023 | -1.062 | -0.6052 | Yes | ||
| 8 | BCL2L11 | 18216 | -1.096 | -0.5704 | Yes | ||
| 9 | IL7 | 19888 | -1.525 | -0.5860 | Yes | ||
| 10 | FYN | 20107 | -1.612 | -0.5319 | Yes | ||
| 11 | STAT3 | 21136 | -2.226 | -0.4903 | Yes | ||
| 12 | STAT5B | 21219 | -2.310 | -0.4022 | Yes | ||
| 13 | JAK3 | 21578 | -3.015 | -0.2987 | Yes | ||
| 14 | IL2RG | 21665 | -3.322 | -0.1706 | Yes | ||
| 15 | PTK2B | 21837 | -4.616 | 0.0050 | Yes |
