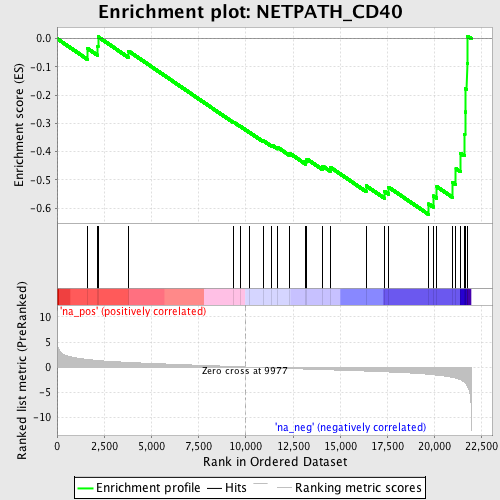
Profile of the Running ES Score & Positions of GeneSet Members on the Rank Ordered List
| Dataset | set02_ATM_minus_versus_BT_ATM_minus |
| Phenotype | NoPhenotypeAvailable |
| Upregulated in class | na_neg |
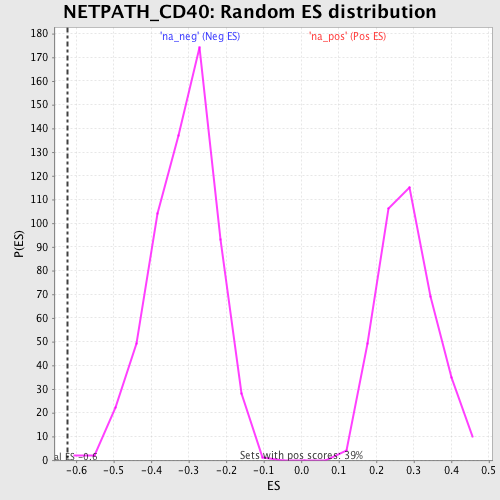
| GeneSet | NETPATH_CD40 |
| Enrichment Score (ES) | -0.62211424 |
| Normalized Enrichment Score (NES) | -1.9952958 |
| Nominal p-value | 0.001633987 |
| FDR q-value | 0.031631265 |
| FWER p-Value | 0.115 |
| PROBE | GENE SYMBOL | GENE_TITLE | RANK IN GENE LIST | RANK METRIC SCORE | RUNNING ES | CORE ENRICHMENT | |
|---|---|---|---|---|---|---|---|
| 1 | TRAF6 | 1621 | 1.510 | -0.0353 | No | ||
| 2 | PIK3R1 | 2157 | 1.312 | -0.0261 | No | ||
| 3 | CBL | 2171 | 1.305 | 0.0067 | No | ||
| 4 | XRCC6 | 3793 | 0.910 | -0.0440 | No | ||
| 5 | TTRAP | 9351 | 0.098 | -0.2950 | No | ||
| 6 | CAV1 | 9719 | 0.041 | -0.3107 | No | ||
| 7 | XRCC5 | 10168 | -0.029 | -0.3304 | No | ||
| 8 | RHOD | 10936 | -0.146 | -0.3616 | No | ||
| 9 | RAF1 | 11386 | -0.204 | -0.3769 | No | ||
| 10 | HRAS | 11684 | -0.237 | -0.3844 | No | ||
| 11 | TRAF2 | 12318 | -0.311 | -0.4053 | No | ||
| 12 | PIK3R2 | 13171 | -0.410 | -0.4336 | No | ||
| 13 | MAP3K8 | 13234 | -0.417 | -0.4258 | No | ||
| 14 | BIRC2 | 14071 | -0.516 | -0.4507 | No | ||
| 15 | REL | 14487 | -0.568 | -0.4551 | No | ||
| 16 | CD40LG | 16375 | -0.807 | -0.5205 | No | ||
| 17 | BIRC3 | 17339 | -0.944 | -0.5403 | No | ||
| 18 | RELA | 17566 | -0.984 | -0.5254 | No | ||
| 19 | TP53 | 19687 | -1.455 | -0.5849 | Yes | ||
| 20 | IL4R | 19931 | -1.540 | -0.5565 | Yes | ||
| 21 | TRAF3IP2 | 20123 | -1.619 | -0.5238 | Yes | ||
| 22 | NFKB1 | 20944 | -2.065 | -0.5083 | Yes | ||
| 23 | STAT3 | 21136 | -2.226 | -0.4600 | Yes | ||
| 24 | CD40 | 21382 | -2.536 | -0.4063 | Yes | ||
| 25 | JAK3 | 21578 | -3.015 | -0.3380 | Yes | ||
| 26 | NFKB2 | 21615 | -3.137 | -0.2593 | Yes | ||
| 27 | TRAF3 | 21651 | -3.256 | -0.1775 | Yes | ||
| 28 | TRAF1 | 21720 | -3.630 | -0.0877 | Yes | ||
| 29 | RELB | 21749 | -3.826 | 0.0090 | Yes |