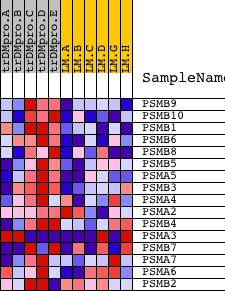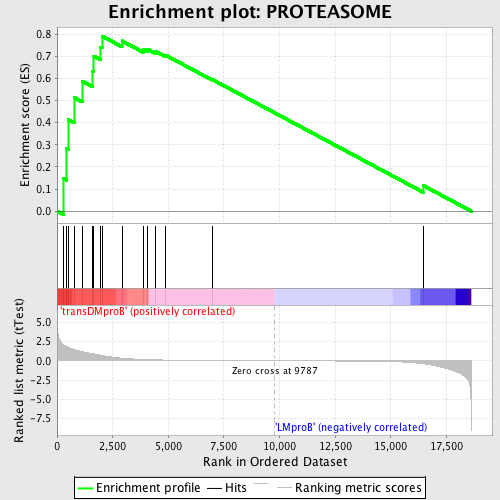
Profile of the Running ES Score & Positions of GeneSet Members on the Rank Ordered List
| Dataset | Set_04_transDMproB_versus_LMproB.phenotype_transDMproB_versus_LMproB.cls #transDMproB_versus_LMproB |
| Phenotype | phenotype_transDMproB_versus_LMproB.cls#transDMproB_versus_LMproB |
| Upregulated in class | transDMproB |
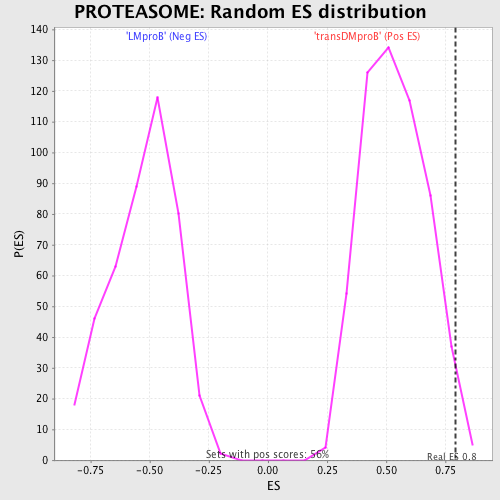
| GeneSet | PROTEASOME |
| Enrichment Score (ES) | 0.79140806 |
| Normalized Enrichment Score (NES) | 1.473848 |
| Nominal p-value | 0.028419184 |
| FDR q-value | 0.36362386 |
| FWER p-Value | 0.996 |
| PROBE | DESCRIPTION (from dataset) | GENE SYMBOL | GENE_TITLE | RANK IN GENE LIST | RANK METRIC SCORE | RUNNING ES | CORE ENRICHMENT | |
|---|---|---|---|---|---|---|---|---|
| 1 | PSMB9 | 23021 | 277 | 2.071 | 0.1478 | Yes | ||
| 2 | PSMB10 | 5299 18761 | 416 | 1.833 | 0.2844 | Yes | ||
| 3 | PSMB1 | 23118 | 508 | 1.706 | 0.4135 | Yes | ||
| 4 | PSMB6 | 9634 | 775 | 1.454 | 0.5134 | Yes | ||
| 5 | PSMB8 | 5000 | 1132 | 1.179 | 0.5869 | Yes | ||
| 6 | PSMB5 | 9633 | 1607 | 0.915 | 0.6333 | Yes | ||
| 7 | PSMA5 | 6464 | 1654 | 0.889 | 0.7007 | Yes | ||
| 8 | PSMB3 | 11180 | 1944 | 0.724 | 0.7420 | Yes | ||
| 9 | PSMA4 | 11179 | 2022 | 0.681 | 0.7914 | Yes | ||
| 10 | PSMA2 | 9631 | 2917 | 0.334 | 0.7696 | No | ||
| 11 | PSMB4 | 15252 | 3866 | 0.166 | 0.7317 | No | ||
| 12 | PSMA3 | 9632 5298 | 4081 | 0.144 | 0.7315 | No | ||
| 13 | PSMB7 | 2795 14598 | 4408 | 0.117 | 0.7232 | No | ||
| 14 | PSMA7 | 14318 | 4864 | 0.092 | 0.7059 | No | ||
| 15 | PSMA6 | 21270 | 6976 | 0.035 | 0.5952 | No | ||
| 16 | PSMB2 | 2324 16078 | 16450 | -0.389 | 0.1164 | No |