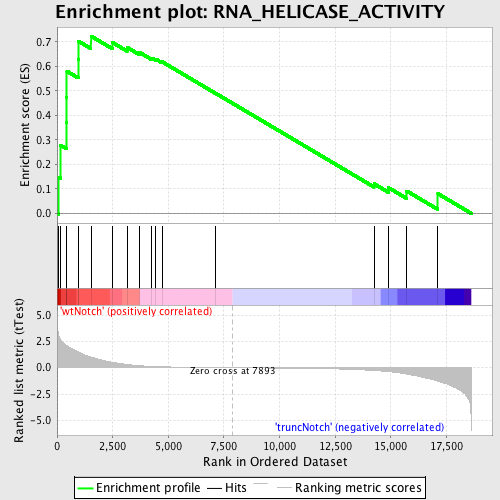
Profile of the Running ES Score & Positions of GeneSet Members on the Rank Ordered List
| Dataset | Set_03_truncNotch_versus_wtNotch.phenotype_truncNotch_versus_wtNotch.cls #wtNotch_versus_truncNotch.phenotype_truncNotch_versus_wtNotch.cls #wtNotch_versus_truncNotch_repos |
| Phenotype | phenotype_truncNotch_versus_wtNotch.cls#wtNotch_versus_truncNotch_repos |
| Upregulated in class | wtNotch |
| GeneSet | RNA_HELICASE_ACTIVITY |
| Enrichment Score (ES) | 0.7237477 |
| Normalized Enrichment Score (NES) | 1.598352 |
| Nominal p-value | 0.013888889 |
| FDR q-value | 0.33411616 |
| FWER p-Value | 0.977 |
| PROBE | DESCRIPTION (from dataset) | GENE SYMBOL | GENE_TITLE | RANK IN GENE LIST | RANK METRIC SCORE | RUNNING ES | CORE ENRICHMENT | |
|---|---|---|---|---|---|---|---|---|
| 1 | DDX18 | 6980619 | 81 | 2.983 | 0.1473 | Yes | ||
| 2 | DDX20 | 3290348 | 162 | 2.649 | 0.2777 | Yes | ||
| 3 | DHX15 | 870632 | 428 | 2.087 | 0.3696 | Yes | ||
| 4 | DDX1 | 3450047 | 435 | 2.082 | 0.4752 | Yes | ||
| 5 | DDX21 | 6100446 | 442 | 2.073 | 0.5803 | Yes | ||
| 6 | DDX3X | 2190020 | 949 | 1.484 | 0.6285 | Yes | ||
| 7 | DHX38 | 780243 | 960 | 1.474 | 0.7030 | Yes | ||
| 8 | DDX25 | 5910121 | 1523 | 1.003 | 0.7237 | Yes | ||
| 9 | DDX6 | 2630025 6770408 | 2488 | 0.510 | 0.6979 | No | ||
| 10 | SKIV2L | 3780278 4570092 | 3144 | 0.300 | 0.6779 | No | ||
| 11 | DHX8 | 6100139 | 3706 | 0.188 | 0.6573 | No | ||
| 12 | DDX56 | 2030195 | 4251 | 0.123 | 0.6343 | No | ||
| 13 | DHX9 | 60017 1170095 2260014 | 4433 | 0.107 | 0.6300 | No | ||
| 14 | UPF1 | 430164 1190750 | 4728 | 0.087 | 0.6186 | No | ||
| 15 | DDX10 | 520746 | 7130 | 0.013 | 0.4901 | No | ||
| 16 | DHX16 | 940044 | 14244 | -0.263 | 0.1210 | No | ||
| 17 | G3BP1 | 4780373 7100450 7100576 | 14903 | -0.371 | 0.1045 | No | ||
| 18 | EIF4A3 | 3440538 | 15717 | -0.601 | 0.0914 | No | ||
| 19 | DDX54 | 6220324 | 17117 | -1.267 | 0.0806 | No |

